
Infographic: Price of Water in 30 Major U.S. Cities (2010-2015)
Visit our current water rates data dashboard
Cities raise rates to pay for repairs and to respond to conservation.
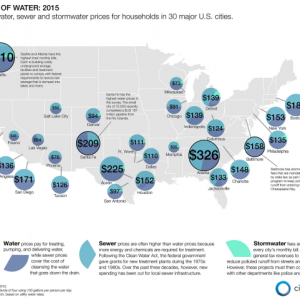
The average price of residential water increased by 6 percent between 2014 and 2015, according to Circle of Blue’s comparison of water rates for 20 of the largest U.S. cities and 10 regional representatives. Prices have climbed by 41 percent since 2010. Both figures are for a family of four using 380 liters (100 gallons) per person per day.
The price of a monthly water bill varies greatly across the United States, depending more on the condition of infrastructure and on the types of rates that are charged than on water availability or climate.
The stacked bar charts in the graphic below show the price changes in 30 U.S. cities for each year since 2010, when the Circle of Blue survey began. The cities are listed in alphabetical order. The segments on the bars represent the prices at three different levels of use: 50, 100, and 150 gallons per person per day for a family of four. The bottom and darkest color in the charts for each year represents the 50-gallon-per-person level, while the top, lightest color represents the 150-gallon level. An average bill for each city depends on how much water is used. (Note: One cannot simply multiply the 50-gallon price by three to get the 150-gallon price, because some cities have different rates for different levels of usage.)

Water rates and prices reflect the cost of building, maintaining, and operating the pipes, pumps, and treatment facilities that cleanse and deliver water to homes and businesses. Residential water prices often reveal very little about regional water scarcity. In fact, some of the lowest prices in Circle of Blue’s survey are desert cities in the Southwest.
Rather, prices are mostly about infrastructure and the energy, chemicals, and labor that go into operating costs. Those cities with higher rates and prices are mostly in the middle of a large infrastructure expansion or have recently completed one and are still paying off the debt.
- Chicago, for example, is doubling rates in order to speed up its replacement of old water mains. Prices have climbed 90 percent since 2010.
- Fresno — though it currently has the lowest prices — is beginning a five-year plan to nearly double rates to pay for new water-supply and -treatment capacity. Its rates actually dropped in 2014, when the City Council revoked a rate increase after civic opposition.
- Austin, meanwhile, is raising rates faster for its highest-volume users to encourage conservation, while increasing its overall rates to rebalance its revenues because of declining water sales. Since 2010, prices for a household using 400 gallons per day shot up 121 percent, while a household using 200 gallons per day saw only an 83 percent increase. Due to drought restrictions on lawn-watering and higher water rates, the city utility sold 10 billion fewer gallons in 2014 compared to 2011, a 20 percent cut. With operating costs relatively flat, the unit cost of water must go up to balance the budget.
- Santa Fe has the highest water prices in the survey. The New Mexico capital is a smaller city — roughly 70,000 residents — but it recently completed a large infrastructure project, a pipeline from the Rio Grande that cost ratepayers $US 187 million. Fewer customers for an expensive project means higher individual bills.
Though rates are increasing, residents can reduce bills by using less water. Rates for most cities are divided in two: a fixed charge that is paid regardless of how much water is used and a variable charge that is based on usage.
Austin, however, has instituted a second fixed charge that is based on usage. City managers say that this charge will allocate more of the cost of maintaining the system to those with the highest demands.
This infographic was made to accompany Brett Walton’s Price of Water 2015: Up 6 Percent for 30 Major U.S. Cities. Contact Brett Walton or send a tweet to @WaltonWater.
is both a scientist and a journalist, she holds an MS in Environmental Engineering from Michigan Technological University, and she brings proficiency in ESRI’s ArcGIS mapping software.
JGanter_G3_0256")


Leave a Reply
Want to join the discussion?Feel free to contribute!