

Infographic: Water – An Unequal Human Right
Runner-up in the 2011 Urban Water Design Challenge, sponsored by Visualizing.org and Circle of Blue.
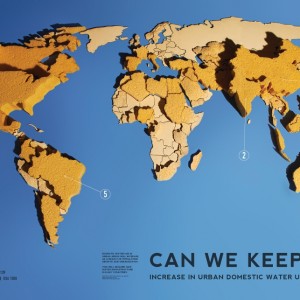
Tuduyen Nguyen and Cameron Reynolds-Flatt earned a runner-up prize in the 2011 Urban Water Design Challenge—sponsored by Circle of Blue and Visualizing.org—for their graphic illustration, “Water: An Unequal Human Right,” which gives an unvarnished look at the many imbalances of water around the world.

The left side displays water consumption patterns in wealthy “consuming” countries—20 gallons daily down the toilet per American, 50 billion bottles consumed annually, 15,000 gallons lost to leaky plumbing—versus “developing” countries, where 90 percent of sewage and 70 percent of industrial waste is discharged without treatment and where women and children spend 40 billion hours annually walking for water. The right side of the graphic has a visual roster showing water discrepancies and is reminiscent of Harper’s Index.
See the other winning designs here.
Did you miss your chance to participate? Designers can continue to share their visualizations throughout the year by uploading to visualizing.org.
Circle of Blue provides relevant, reliable, and actionable on-the-ground information about the world’s resource crises.


")


Leave a Reply
Want to join the discussion?Feel free to contribute!