Price of Water 2014: Up 6 Percent in 30 Major U.S. Cities; 33 Percent Rise Since 2010
Visit our current water rates data dashboard
Water scarcity and successful conservation programs force utilities to adapt their business plans.
By Brett Walton
Circle of Blue
The price of water rose again in 2014, though less steeply than in previous years, according to Circle of Blue’s annual survey of single-family residential water rates in 30 major U.S. cities.
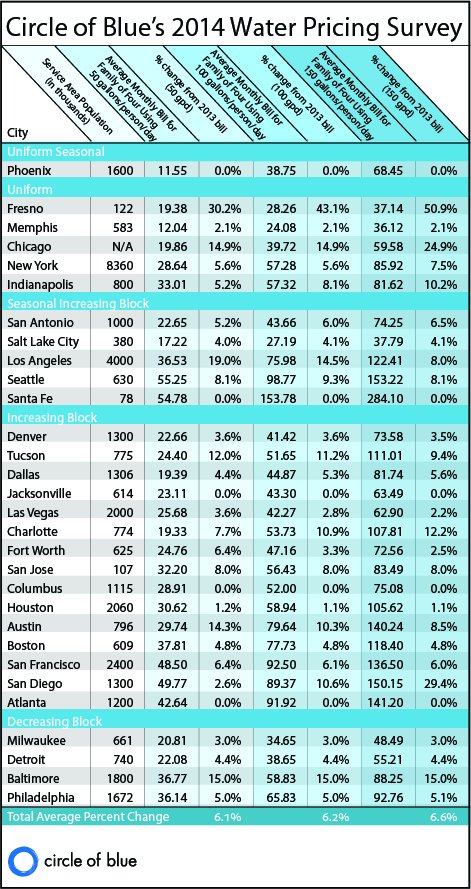
The average price for a family of four using 100 gallons per person per day increased 6.2 percent, the smallest year-to-year change in the five-year history of the survey. The median increase was 5.2 percent.
For families using 150 gallons and 50 gallons per person per day, average prices rose 6.6 percent and 6.1 percent, respectively.
The pricing survey reveals parallel trends in the municipal water business.
On one hand, utilities are raising rates to keep pace with rising costs for new pipes, treatment facilities, and, in certain cases, for water itself.
But water providers are also changing the structure of their rates; that is, how much residents are charged each month for access to the municipal system versus how much they pay for a gallon of water. Fussing with the latter – by charging high-volume users more – can encourage conservation. Altering both the monthly fee and the volume fee can help a utility adapt to conservation’s ill effect: a drop in revenue.
Annual rate increases quickly build over time. Since 2010, average prices rose 33 percent for the index, the equivalent of adding $US 15 per month to a $US 45 water bill.
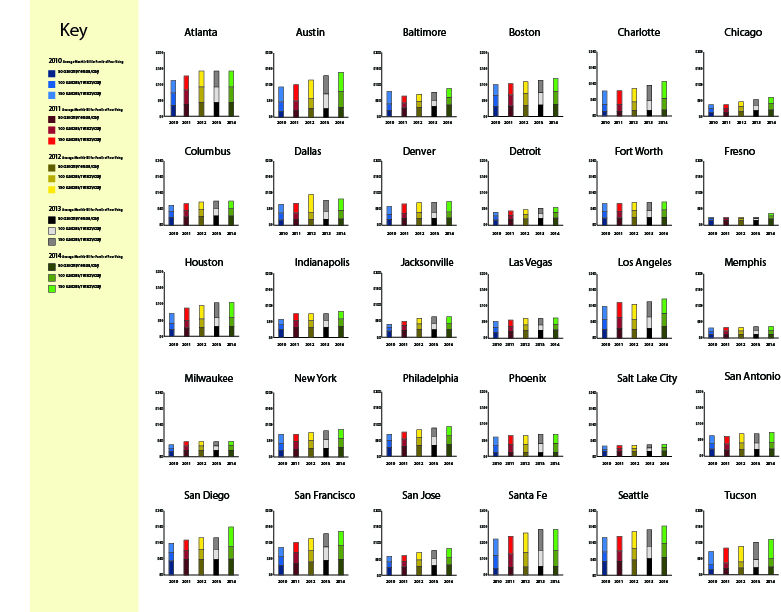
Residents in some areas are paying even more. Prices in five cities – Austin, Charlotte, Chicago, San Francisco, and Tucson – ballooned more than 50 percent over five years. Chicago’s increase, for instance, is part of a municipal water investment plan, initiated in 2011, to double rates over four years, primarily to replace dilapidated pipes, some a century old.
These examples are striking, but they are increasingly common, as the cost of water outpaces the cost of other staple household goods, reckons Bill Stannard, president of Raftelis, a rates consultancy.
“What we’re seeing now, for the foreseeable future, is that the annual increase in revenue will exceed the Consumer Price Index by double on average,” Stannard told Circle of Blue. “That’s how much revenue will be needed to fund utilities.”
Raftelis collaborates with the American Water Works Association, an industry group, on a biannual rate survey, which included data from 290 water utilities in 2012. Between 1996 and 2012, rates increased an average of 4.9 percent annually for water, Stannard said.
Shaking the Money Tree
These are strange days for water utilities.
Unlike many businesses, they are encouraging customers to buy less of their product. Some of the decrease in demand is incidental: new plumbing codes, low-flow toilets, and showerheads that spritz instead of splash have reduced the amount of water flowing into the home. The economic recession starting in 2008 forced families to cut back in every way possible, including water consumption.
But conservation is also an explicit policy. Utilities in dry regions pay homeowners to rip out lawns. Fuzzy civic mascots visit schoolrooms to preach the virtues of a short shower. And over the last three decades, price signals became popular. The more water a household used, the more expensive each gallon became. Some cities, Santa Fe most notably, approved charges so high that price acted as a stop sign.
These measures are causing per capita demand in most cities to fall, and in some cases plummet. Water consumption in Tucson, for example, fell 8 percent between 2010 and 2013. Households in Fort Worth, Texas, did even better, chopping demand by 18 percent between 2006 and 2013, and the fast-growing city expects more savings from new rules adopted in April that permanently restrict lawn-watering to twice per week.
The drop in demand had clear benefits, said Mary Gugliuzza, water department spokeswoman. Fort Worth put off pricy expansions of existing treatment plants and construction of a new plant, not needing for now the added capacity. Delaying those investments is saving the city $US 20 million per year in borrowing costs. If the three projects had been built according to the plan set forth in 2005, residential water rates today would be 10 percent higher.
But for many utilities, conservation success exposed a financial vulnerability. Because most of their revenue – 80 percent or more, on average – came from water sales, a sudden drop caused the balance sheet to tilt dangerously toward the red. Less water sold is less money earned. Relying so heavily on an income stream that is at odds with the zeitgeist and varies with the weather required a rebalancing act.
To stabilize revenues, several utilities in Circle of Blue’s survey are putting more of their rate increases into fixed monthly charges – fees paid regardless of how much water is used. Austin, Fort Worth, and Tucson are three examples. This increase in fixed fees means that even those who use water sparingly are paying more.
As fits a conservative industry, utilities are making these shifts slowly. Fort Worth is in the middle of a five-year plan to increase the share of its revenue that comes from fixed fees, from 17 percent to 25 percent.
Divergent Pressures
Though a handful of utilities are changing the balance between fixed and variable revenue, many are not, said Shadi Eskaf, a researcher at the University of North Carolina’s Environmental Finance Center. It is difficult to generalize about a country with many thousands of utilities with different financial pressures in diverse climate zones, he told Circle of Blue.
“The trends are divergent,” Eskaf explained. “There are a small number of utilities that catch on to the need to increase fixed revenue. But actually more are increasing the variable portion of the bill.”
The decision about which course to take depends on local circumstances. If water scarcity is the greater concern, then a utility might use rate increases to clamp down on demand.
That is the case in San Diego, which both raised rates and changed its rate structure last year. The entire rate increase was necessary to pay for rising wholesale water costs in Southern California. And to encourage water thrift, the department decreased its fixed fee while approving higher charges for high-volume users.
“We added a price tier at the high end to help people understand that if you use a lot of water [you will pay more],” Kurt Kidman, department spokesman, told Circle of Blue. “We live in a desert, and it would be good to conserve.”
Scarcity is the driving factor now, but as household faucets flow with less force, San Diego, like its dry-climate brethren in Arizona and Texas, may find itself in need of a rate makeover. And that would signal a conservation success story.
Circle of Blue gathered water rate information from the web site of each city’s water utility or from phone calls or emails to the utilities. Prices are based on single-family residential rates and are current as of April 1, 2014. Rates include fixed fees, volumetric fees, and surcharges. Average monthly prices for cities with seasonal rates were calculated using seasonal weighting. The fixed fees cited in the article are for 5/8 inch meters, the most common size for residential connections.
Brett writes about agriculture, energy, infrastructure, and the politics and economics of water in the United States. He also writes the Federal Water Tap, Circle of Blue’s weekly digest of U.S. government water news. He is the winner of two Society of Environmental Journalists reporting awards, one of the top honors in American environmental journalism: first place for explanatory reporting for a series on septic system pollution in the United States(2016) and third place for beat reporting in a small market (2014). He received the Sierra Club’s Distinguished Service Award in 2018. Brett lives in Seattle, where he hikes the mountains and bakes pies. Contact Brett Walton






Thanks – this is interesting information. Have you looked at whether there is a difference in how public utilities and private water companies are structuring their pricing?
Thanks for the reporting. Is a legible version of the bar chart available for viewing?
Can you provide a higher resolution image of the bar charts? Thanks!
To everyone asking about higher-resolution images: we’re working on it. We’re also looking at a better way to present the five years of data we have.
IDoes the chart above list just strictly water costs, or water & sewer? (usually there is a separate sewer fee per gallon used and a monthly fixed fee as well).
Amy, these prices are just for water. We did a sewer survey in 2010 but have not updated it since:
http://99.198.125.162/~circl731/2010/world/the-price-of-wastewater-a-comparison-of-sewer-rates-in-30-u-s-cities/
I’m glad to see (1) rate increases to improve fiscal and environmental stability and (2) your accurate description of the need to shift revenues onto fixed charges to keep finances stable. As you may know, I’ve squared the circle on shifting to fixed charges AND encouraging conservation by adding a third (scarcity) charge. You can read about it in this post (http://www.aguanomics.com/2011/09/time-to-dump-increasing-block-rates.html) as well as in my book (Living with Water Scarcity), which is much clearer.
Nice article Brett,
Demand side conservation is clearly a priority for the US in certain areas due to the drought conditions but have you investigated and written articles on distribution losses or NRW in the US? Clearly, with volume-based consumption tariffs, water utility revenues will reduce due to water conservation but if the utilities reduce NRW then their overheads decrease, especially in areas where the cost of production and distribution is high.
The public in the UK are much more receptive to water conservation on their side when they see steps being made to tackle water loss on the utility side.
I’d be interested in the US view on this point.
Regards,
David
David,
I haven’t dug deeply into actions to reduce non-revenue water (NRW),
but a sidebar on my 2011 water prices update shows the increased use of advanced
metering technology, which can help detect leaks more quickly and reduce losses
that way. Many utilities – I don’t have recent figures, but Xylem or another such
company might – are investing in this.
The sidebar is near the bottom:
http://99.198.125.162/~circl731/2011/world/the-price-of-water-2011-prices-rise-an-average-of-9-percent-in-major-u-s-cities/
What is the price per gallon? Are meters set to measure per gallon, liter or less?
Ronald,
The price per gallon often varies depending on how many gallons a household uses. Prices are usually stated per 1,000 gallons or 100 cubic feet, which equals 748 gallons.
Many cities have what is called an increasing block rate, which means that you pay more per gallon the more water you use. An example is Las Vegas. For the first 5,000 gallons, a household pays $1.16 per 1,000 gallons, or 1.1 cents for 10 gallons (quite a deal!). After 20,000 gallons, however, the cost per 1,000 gallons is $4.58, or 4.5 cents for 10 gallons (still, quite a bargain).
There are also fixed charges that have to be factored in. Las Vegas, for example, charges $10.06 per month just to be connected to the system, regardless of the amount of water used.
Academic studies use a tool called an average price curve that shows the average price per gallon for various levels of consumption. Page 10 of this presentation shows a few examples: http://www2.bren.ucsb.edu/~santaana/Documents/Water%20Rate%20Structures.pdf
Hope this helps.
Yet another article that completely ignores population growth and its chief driver – immigration.
Here in California we are essentially providing water to the rest of the world.
http://www.capsweb.org/sites/default/files/direct_and_indirect_contribution_of_immigration_to_cal_growth_2000-2010_0.pdf
Lincoln city in California raised the water price more than double. In 2017, from about $54 for 10,000 gallons (price included garbage and sewer), in 2017, the price will be about $154. Today, for about 4000 gallons/month, the cost is about $86. The fixed price is the culprit! I perceive this as another form of taxation, not necessary related to the true price for the water, but to get more income for the City Hall!