Census of Agriculture Data Is Christmas for Farm Nerds
Farm data galore – by county and state, as well as nationally.
Every five years, the U.S. Department of Agriculture takes on the Herculean task of assessing the state of the American farm economy.
Today, the USDA released the 2012 agriculture census, to the giddy delight of agronomists, economists, and arm-chair dataphiles.
The numbers cover a stunningly broad territory, from fine-grained county assessments of production and expenses to national summaries of farms and their owners.
How many Christmas trees did Rutland County, Vermont cut in 2012? 1,335.
How much wheat did Kansas produce? 359 million bushels.
How old is the average U.S. farm operator? 58.3 years (up from 50.5 in 1982).
Making sense of the heaps of data could occupy your entire weekend and much of next week. I’ll be taking a look at the irrigation figures. Already a few things stand out.
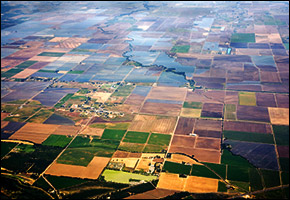
- Nebraska keeps its title as irrigation champion. Nebraska irrigates 8.3 million acres of land, topping California, the runner up, with 7.9 million.
- Irrigation is moving eastward. No longer the domain of the dry west, irrigation is establishing a pivot-hold in the Corn Belt and the Midwest and is becoming dominant in the Mississippi Delta.
- Assessing this trend requires a string of data points, so I’ll be looking at census figures from 2002 and 1997. Irrigated land in Arkansas, for instance, jumped by 27 percent between 1997 and 2012. In Michigan, the increase was even greater: 45 percent in the same time period.
- Irrigation is immensely beneficial. The top county in terms of farm sales is Fresno County, California, which brought in $US 4.97 billion in 2012 – more sales than 23 states. Fresno grows a lot of premium crops (almonds and pistachios, grapes and oranges) and nearly all of them are irrigated.
Notice anything interesting in the data? Contact Brett Walton or Twitter @waltonwater
Brett writes about agriculture, energy, infrastructure, and the politics and economics of water in the United States. He also writes the Federal Water Tap, Circle of Blue’s weekly digest of U.S. government water news. He is the winner of two Society of Environmental Journalists reporting awards, one of the top honors in American environmental journalism: first place for explanatory reporting for a series on septic system pollution in the United States(2016) and third place for beat reporting in a small market (2014). He received the Sierra Club’s Distinguished Service Award in 2018. Brett lives in Seattle, where he hikes the mountains and bakes pies. Contact Brett Walton


Leave a Reply
Want to join the discussion?Feel free to contribute!