
Posts
 https://www.circleofblue.org/wp-content/uploads/2012/05/hans.jpg
412
567
Heather Rousseau
https://www.circleofblue.org/wp-content/uploads/2018/06/Circle-of-Blue-Water-Speaks-600x139.png
Heather Rousseau2012-05-21 14:15:422012-08-13 14:10:31Video: Mapping Grand Traverse Bay with the Great Lakes Water Studies Institute
https://www.circleofblue.org/wp-content/uploads/2012/05/hans.jpg
412
567
Heather Rousseau
https://www.circleofblue.org/wp-content/uploads/2018/06/Circle-of-Blue-Water-Speaks-600x139.png
Heather Rousseau2012-05-21 14:15:422012-08-13 14:10:31Video: Mapping Grand Traverse Bay with the Great Lakes Water Studies Institute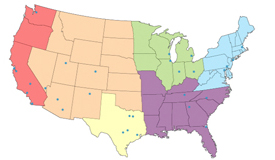 https://www.circleofblue.org/wp-content/uploads/2012/05/073_us-map2751.jpg
160
275
Circle of Blue
https://www.circleofblue.org/wp-content/uploads/2018/06/Circle-of-Blue-Water-Speaks-600x139.png
Circle of Blue2012-05-14 17:12:112012-07-02 10:47:58Map: 2012 Water Prices in 30 Major U.S. Cities
https://www.circleofblue.org/wp-content/uploads/2012/05/073_us-map2751.jpg
160
275
Circle of Blue
https://www.circleofblue.org/wp-content/uploads/2018/06/Circle-of-Blue-Water-Speaks-600x139.png
Circle of Blue2012-05-14 17:12:112012-07-02 10:47:58Map: 2012 Water Prices in 30 Major U.S. Cities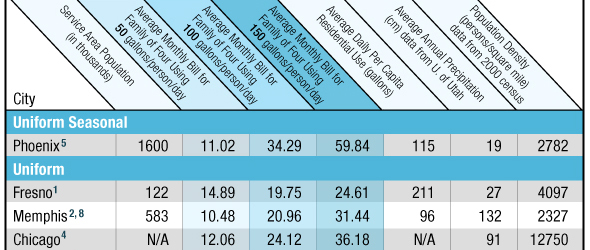 https://www.circleofblue.org/wp-content/uploads/2012/05/water-pricing-survey-u-s.jpg
250
590
Circle of Blue
https://www.circleofblue.org/wp-content/uploads/2018/06/Circle-of-Blue-Water-Speaks-600x139.png
Circle of Blue2012-05-11 14:40:282013-03-12 10:16:27Infographic: 2010, 2011, and 2012 Water Pricing Survey for 30 Major U.S. Cities
https://www.circleofblue.org/wp-content/uploads/2012/05/water-pricing-survey-u-s.jpg
250
590
Circle of Blue
https://www.circleofblue.org/wp-content/uploads/2018/06/Circle-of-Blue-Water-Speaks-600x139.png
Circle of Blue2012-05-11 14:40:282013-03-12 10:16:27Infographic: 2010, 2011, and 2012 Water Pricing Survey for 30 Major U.S. Cities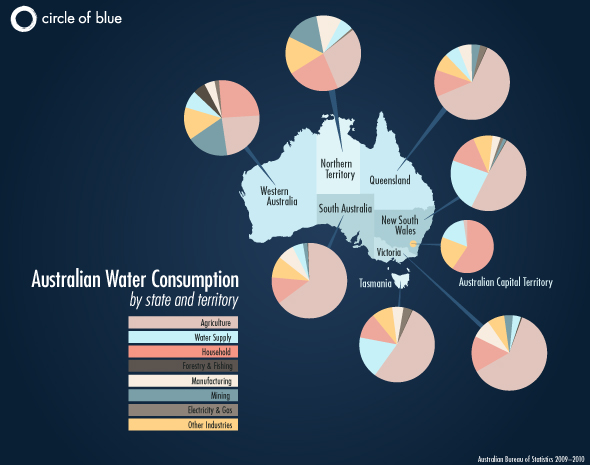 https://www.circleofblue.org/wp-content/uploads/2012/05/NadyaAustralia590px1.jpg
465
590
Circle of Blue
https://www.circleofblue.org/wp-content/uploads/2018/06/Circle-of-Blue-Water-Speaks-600x139.png
Circle of Blue2012-05-04 13:44:402012-05-10 08:49:05Map: Annual Australian Water Use By Individual States and Territories
https://www.circleofblue.org/wp-content/uploads/2012/05/NadyaAustralia590px1.jpg
465
590
Circle of Blue
https://www.circleofblue.org/wp-content/uploads/2018/06/Circle-of-Blue-Water-Speaks-600x139.png
Circle of Blue2012-05-04 13:44:402012-05-10 08:49:05Map: Annual Australian Water Use By Individual States and Territories https://www.circleofblue.org/wp-content/uploads/2012/05/oasis.jpg
503
253
Brett Walton
https://www.circleofblue.org/wp-content/uploads/2018/06/Circle-of-Blue-Water-Speaks-600x139.png
Brett Walton2012-05-04 11:39:452014-03-24 23:47:45Film Review: Last Call at the Oasis
https://www.circleofblue.org/wp-content/uploads/2012/05/oasis.jpg
503
253
Brett Walton
https://www.circleofblue.org/wp-content/uploads/2018/06/Circle-of-Blue-Water-Speaks-600x139.png
Brett Walton2012-05-04 11:39:452014-03-24 23:47:45Film Review: Last Call at the Oasis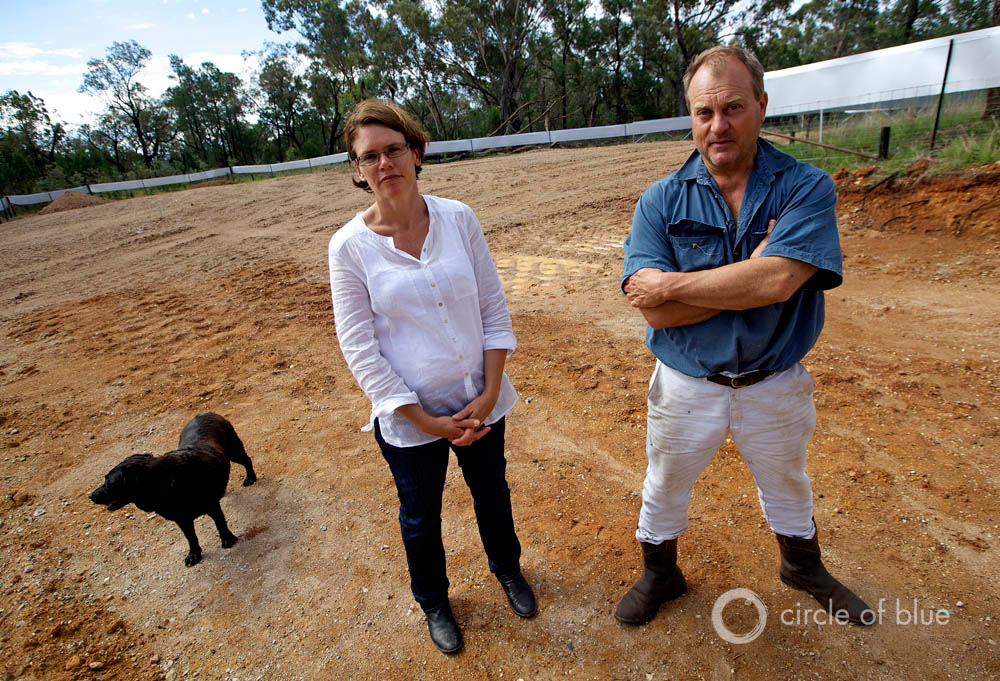 https://www.circleofblue.org/wp-content/uploads/2012/05/AAJ_2011-12-12_ChokePointAustralia-_329-1.jpg
681
1000
Aaron Jaffe
https://www.circleofblue.org/wp-content/uploads/2018/06/Circle-of-Blue-Water-Speaks-600x139.png
Aaron Jaffe2012-05-03 06:00:232012-05-10 08:51:16Photo Slideshow: Australia’s Agriculture and Energy
https://www.circleofblue.org/wp-content/uploads/2012/05/AAJ_2011-12-12_ChokePointAustralia-_329-1.jpg
681
1000
Aaron Jaffe
https://www.circleofblue.org/wp-content/uploads/2018/06/Circle-of-Blue-Water-Speaks-600x139.png
Aaron Jaffe2012-05-03 06:00:232012-05-10 08:51:16Photo Slideshow: Australia’s Agriculture and Energy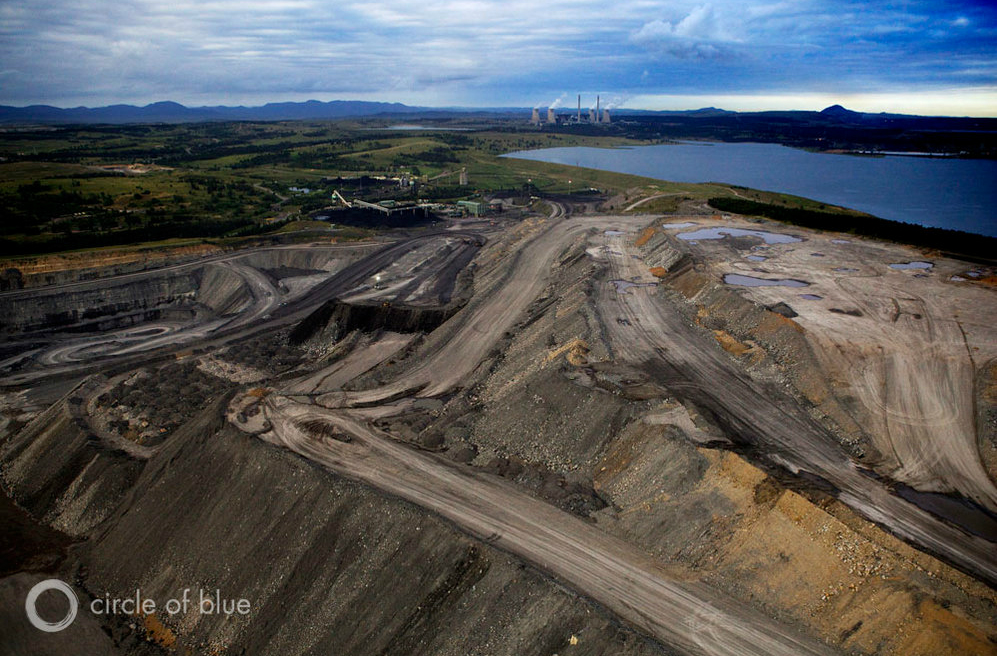 https://www.circleofblue.org/wp-content/uploads/2012/04/slideshowthumb.jpg
656
997
Aaron Jaffe
https://www.circleofblue.org/wp-content/uploads/2018/06/Circle-of-Blue-Water-Speaks-600x139.png
Aaron Jaffe2012-04-20 08:30:152012-05-02 13:17:58Photo Slideshow: Australia’s Coal and Gas Boom Boosted By Asian Demand
https://www.circleofblue.org/wp-content/uploads/2012/04/slideshowthumb.jpg
656
997
Aaron Jaffe
https://www.circleofblue.org/wp-content/uploads/2018/06/Circle-of-Blue-Water-Speaks-600x139.png
Aaron Jaffe2012-04-20 08:30:152012-05-02 13:17:58Photo Slideshow: Australia’s Coal and Gas Boom Boosted By Asian Demand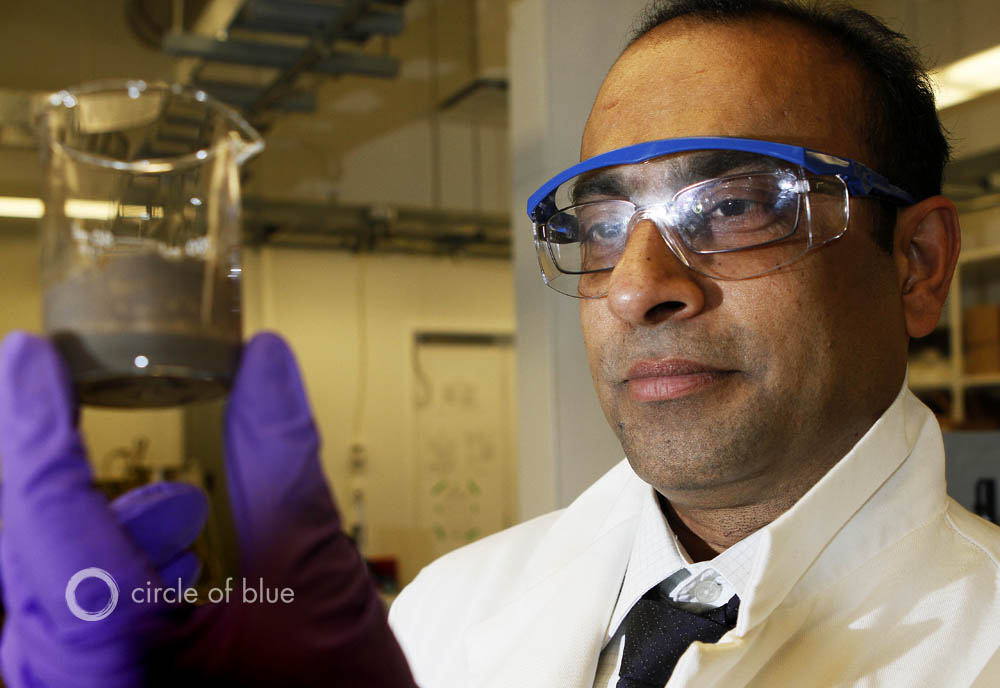 https://www.circleofblue.org/wp-content/uploads/2012/04/JCGANTER_Bhattacharjee_MG_4369.jpg
688
1000
J. Carl Ganter
https://www.circleofblue.org/wp-content/uploads/2018/06/Circle-of-Blue-Water-Speaks-600x139.png
J. Carl Ganter2012-04-11 12:42:502012-04-12 20:44:50Q&A: Subir Bhattacharjee on the Geopolitics of Oil and Alberta’s Tar Sands
https://www.circleofblue.org/wp-content/uploads/2012/04/JCGANTER_Bhattacharjee_MG_4369.jpg
688
1000
J. Carl Ganter
https://www.circleofblue.org/wp-content/uploads/2018/06/Circle-of-Blue-Water-Speaks-600x139.png
J. Carl Ganter2012-04-11 12:42:502012-04-12 20:44:50Q&A: Subir Bhattacharjee on the Geopolitics of Oil and Alberta’s Tar Sands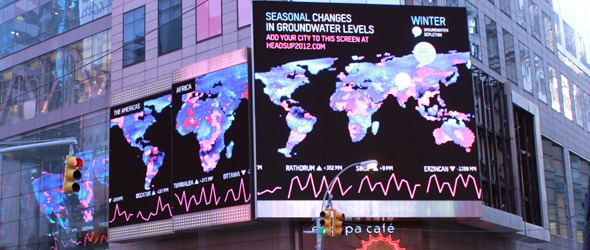 https://www.circleofblue.org/wp-content/uploads/2012/03/times-square-billboard-cb.jpg
250
590
Nadya Ivanova
https://www.circleofblue.org/wp-content/uploads/2018/06/Circle-of-Blue-Water-Speaks-600x139.png
Nadya Ivanova2012-03-28 09:20:052016-01-22 13:59:31Satellite Perspectives: NASA’s GRACE Program Sees Groundwater From Space
https://www.circleofblue.org/wp-content/uploads/2012/03/times-square-billboard-cb.jpg
250
590
Nadya Ivanova
https://www.circleofblue.org/wp-content/uploads/2018/06/Circle-of-Blue-Water-Speaks-600x139.png
Nadya Ivanova2012-03-28 09:20:052016-01-22 13:59:31Satellite Perspectives: NASA’s GRACE Program Sees Groundwater From Space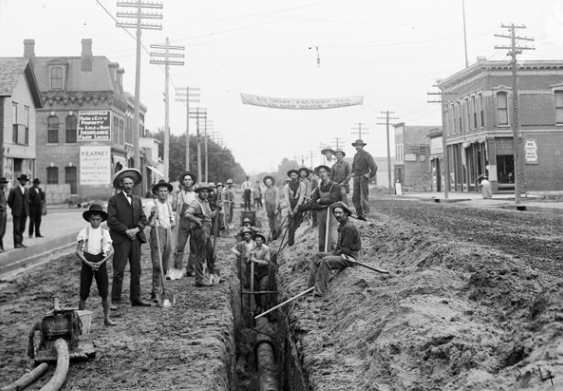 https://www.circleofblue.org/wp-content/uploads/2012/03/water-infra.jpg
391
563
Circle of Blue
https://www.circleofblue.org/wp-content/uploads/2018/06/Circle-of-Blue-Water-Speaks-600x139.png
Circle of Blue2012-03-26 06:00:402016-03-10 13:52:39Photo Slideshow: America’s Water Infrastructure Shows Its Age
https://www.circleofblue.org/wp-content/uploads/2012/03/water-infra.jpg
391
563
Circle of Blue
https://www.circleofblue.org/wp-content/uploads/2018/06/Circle-of-Blue-Water-Speaks-600x139.png
Circle of Blue2012-03-26 06:00:402016-03-10 13:52:39Photo Slideshow: America’s Water Infrastructure Shows Its Age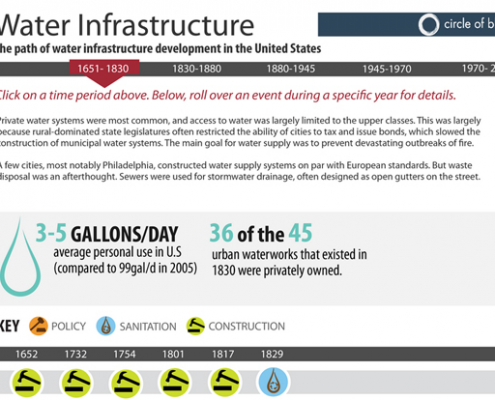 https://www.circleofblue.org/wp-content/uploads/2012/03/Screen-Shot-2016-01-04-at-2.03.48-PM.png
414
566
Circle of Blue
https://www.circleofblue.org/wp-content/uploads/2018/06/Circle-of-Blue-Water-Speaks-600x139.png
Circle of Blue2012-03-21 16:15:232016-03-10 13:53:58Infographic: Timeline of American Water Infrastructure Development (1651-2011)
https://www.circleofblue.org/wp-content/uploads/2012/03/Screen-Shot-2016-01-04-at-2.03.48-PM.png
414
566
Circle of Blue
https://www.circleofblue.org/wp-content/uploads/2018/06/Circle-of-Blue-Water-Speaks-600x139.png
Circle of Blue2012-03-21 16:15:232016-03-10 13:53:58Infographic: Timeline of American Water Infrastructure Development (1651-2011)