Posts

The Stream, March 15: On Weather Extremes, Land Grabs and Nuclear Power
0 Comments
/
Climate Change
Australia should brace itself for higher temperatures…

The Stream, March 5: Severe Drought Grips Portugal
Water Shortages
A severe drought in Portugal is ravaging pastures…

The Stream, February 28: The Future of Water in Central Asia
Water Law
The U.S. Supreme Court has rejected an appeal by five…

The Stream, February 20: Low Water Levels May Hurt Texas Rice Industry
Water-Food
Continuing low water levels in Texas may prompt the…

The Stream, January 20: Mongolia’s Mining Boom
Vast mineral wealth and growing demand from China are driving…

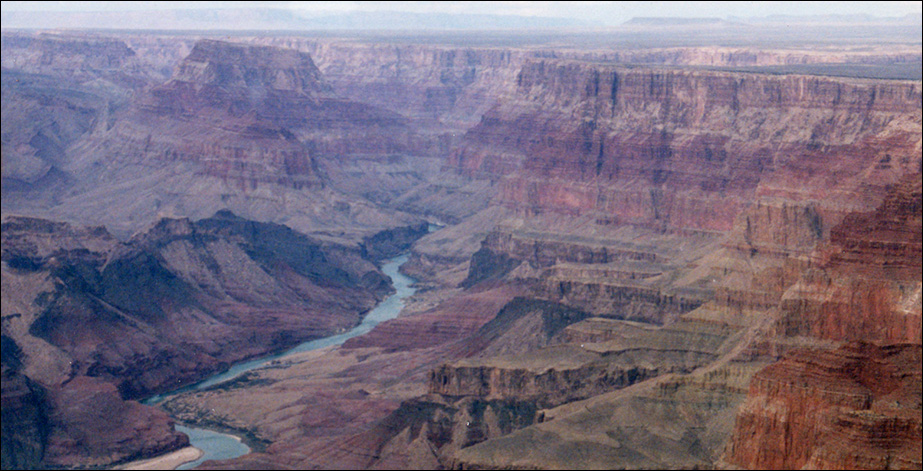
U.S. Administration Bans Uranium Mining Near Grand Canyon
The decision by the U.S. Department of the Interior was applauded…

The Stream, December 16: Australia’s New Food Bowl
An expansive new irrigation proposal could turn northern Australia…

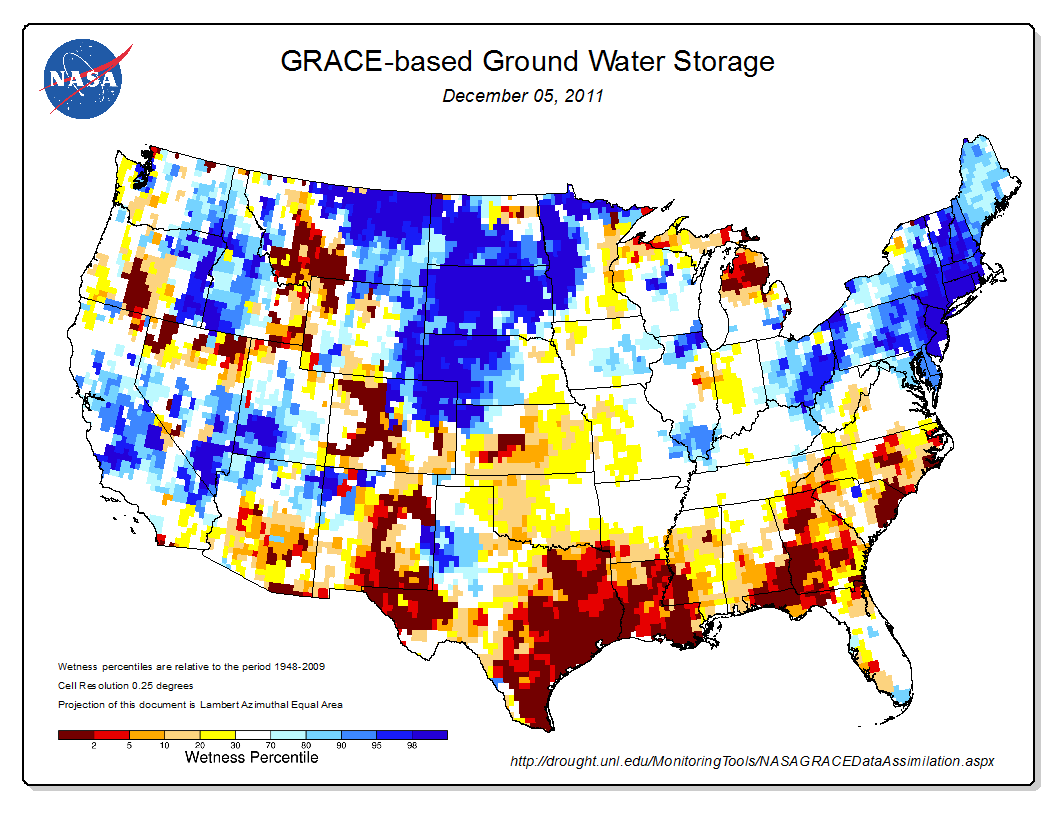
Map: NASA Shows Big Dip in U.S. Groundwater Regionally, Especially Near Texas Drought
Using calculations based on satellite observations and long-term…

Peter Gleick: Transcending Old Thinking About California Agricultural Water Use
The debate about water use in California agriculture is stuck in a 30-year-old rut; relying on outdated and technically-flawed thinking that is slowing statewide efforts to meet 21st century challenges.

The Stream, November 29: New Water Blueprint for Australia’s Food Bowl
ABC Australia has published the Murray-Darling Basin Authority's…

The Stream, October 26: Global Water Demand Outpaces Population Growth
Global water use is increasing at twice the rate of population…

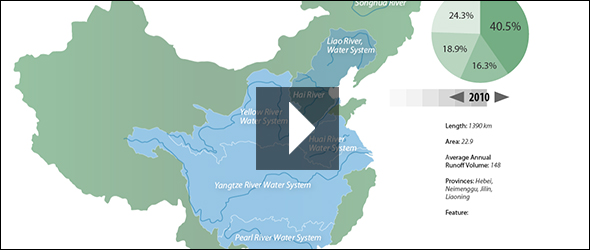
Infographic: Map of Pollution Levels in China’s Major River Basins
The seven major river basins, as a whole, have had steady improvements in water quality over the past decade.

