Circle of Blue
  • Podcasts
  • Water Debt
  • WaterNews
    • WaterNews
      • The Daily Stream
      • Federal Water Tap
      • Weekly Water Newsletter
      • Convenings
    • Current
      • Water, Texas
      • Coronavirus
      • Legionnaires’
      • Australia
      • Fair Bluff
      • After Paradise Burned
      • Water Scarcity in India
      • Michigan’s Groundwater Emergency
      • Groundwater
      • Water Pricing
      • Water Affordability
      • Delhi Waits For Water
  •  Special Features
    •  
      • Water and Financial Risks
      • Stranded Assets
      • Lake Mead
      • Cape Town
      • Flint Water Crisis
      • California Drought
      • Global WaterViews on QlikView
      • Himalayas
      • Hidden Waters, Dragons in the Deep
      • Designing Waters Future
      • Zeropolis
        • Big Cities, Little Water
      • Water and Climate
      • Septic Infrastructure in the U.S.
      • Unearthing Water Risks of The Global Mining Industry
      • Chennai
  • HotSpots H2O
  • Choke Point
    • The World at a Choke Point
      • Choke Point: Australia
      • Choke Point: Tamil Nadu
      • Choke Point: South Africa
      • Choke Point: China
      • Choke Point: India
      • Choke Point: Australia
      • Choke Point: Tehuacán Valley
    • Choke Point: U.S.
      • Choke Point: Index
        • California Central Valley
        • Great Lakes Algae
        • Ogallala Aquifer
        • Water Data
  • About
    • About Circle of Blue
      • Team Members
      • Board of Directors
      • Internships
      • Ethics and Sponsorship
      • Underwriters
      • Contact Us
  • Donate
  • Search
  • Menu

Water, Texas

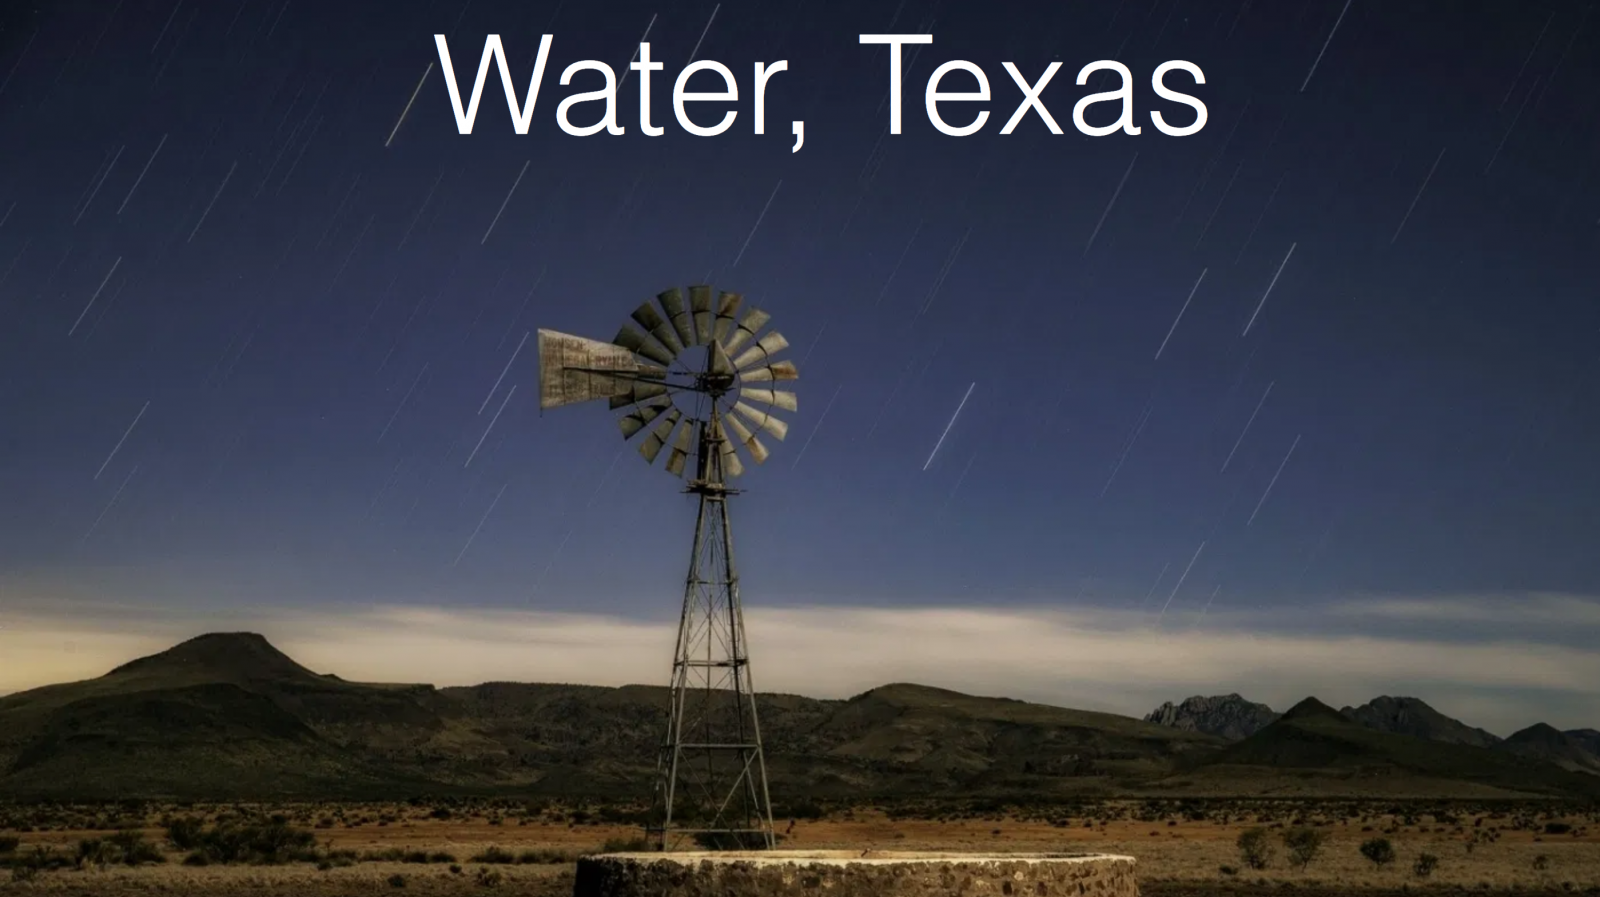
Water, Texas is a five-part series on the consequences of the mismatch between runaway development and tightening constraints on the supply and quality of fresh water in Texas.

The story of Texas is the state’s devout allegiance to the principle that mankind has dominion over nature. In 2020, the pandemic, climate disruption, and ever-present challenges with water supply and use are writing a much different story of vulnerability to nature’s bullying, and to government’s uncertain capacity to adjust.

When It Rains, Texans Forget Drought and Worsening Water Scarcity

After the Pandemic, Soaring Population Growth, Industrial Development Will Again Overwhelm Planning and Water Supply

https://i0.wp.com/www.circleofblue.org/wp-content/uploads/2020/07/20200729_DRONE_JACOBS_WELL_142-Edit-2500-2-1.jpg?fit=1600%2C899&ssl=1 899 1600 Keith Schneider https://www.circleofblue.org/wp-content/uploads/2018/06/Circle-of-Blue-Water-Speaks-600x139.png Keith Schneider2020-08-03 06:01:572020-10-27 13:06:17When It Rains, Texas Forgets Drought and Worsening Water Scarcity
Circle of Blue · When It Rains, Texans Forget Drought And Worsening Water Scarcity

A Pause For Energy Developers Threatening Texas Big Bend Region

Opportunity to Protect A Way of Life Confronted by Oil and Clean Energy

https://i2.wp.com/www.circleofblue.org/wp-content/uploads/2020/08/Screen-Shot-2020-08-31-at-1.56.41-PM.png?fit=1421%2C785&ssl=1 785 1421 Keith Schneider https://www.circleofblue.org/wp-content/uploads/2018/06/Circle-of-Blue-Water-Speaks-600x139.png Keith Schneider2020-08-10 06:24:212020-08-31 14:08:09A Pause For Energy Developers Threatening Texas Big Bend Region
Circle of Blue · A Pause For Energy Developers Threatening Texas Big Bend Region

Three Thirsty Texas Cities Are Global Leaders in Water Innovation

Austin, El Paso, and San Antonio Prepared for Growth and Drought

https://i2.wp.com/www.circleofblue.org/wp-content/uploads/2020/08/20200730_AUSTIN_CENTRAL_LIBRARY_47-1-1.jpg?fit=1600%2C899&ssl=1 899 1600 Keith Schneider https://www.circleofblue.org/wp-content/uploads/2018/06/Circle-of-Blue-Water-Speaks-600x139.png Keith Schneider2020-08-17 07:29:112020-08-31 23:59:04Three Thirsty Texas Cities Are Global Leaders in Water Innovation
Circle of Blue · Three Thirsty Texas Cities Are Global Leaders In Water Innovation

Border Wall Concerns in Lower Rio Grande Valley Diminished By Virus and Growth

Trump Administration Overrides Long-Standing Conservation Mission

https://i0.wp.com/www.circleofblue.org/wp-content/uploads/2020/08/20200801_BORDER_WALL_128-Edit-2500.jpg?fit=1600%2C1067&ssl=1 1067 1600 Keith Schneider https://www.circleofblue.org/wp-content/uploads/2018/06/Circle-of-Blue-Water-Speaks-600x139.png Keith Schneider2020-08-24 07:00:352020-08-31 23:52:41Border Wall Concerns in Lower Rio Grande Valley Diminished By Virus and Growth
Circle of Blue · Border Wall Concerns In Lower Rio Grande Valley Diminished By Virus and Growth

Water Serves Length and Breadth of $1.9 Trillion Texas Economy

Growth in Wet Years, Economic Distress in Dry Ones

https://i2.wp.com/www.circleofblue.org/wp-content/uploads/2020/08/20200802_WIND_TURBINE_DRONE_57-Edit-2500.jpg?fit=1600%2C1066&ssl=1 1066 1600 Keith Schneider https://www.circleofblue.org/wp-content/uploads/2018/06/Circle-of-Blue-Water-Speaks-600x139.png Keith Schneider2020-08-31 06:37:312020-08-31 23:56:09Water Serves Length and Breadth of $1.9 Trillion Texas Economy
Circle of Blue · Water Serves Length And Breadth Of Texas Economy
Circle of Blue · Water, Texas

The Water Texas series makes use of an interactive dashboard that documents water supply, demand, population, and projections from 2020 through 2070. At this time, the dashboard is only supported on desktop devices.

Interactive Data Dashboard

Demand over supply: 

The Demand Over Supply visualization is a calculation of the sums of the water demand divided by the existing supplies of these regions. 

The Demand Over Supply by region, which is the middle visualization, will let you see a bar graph for a specific location by clicking or hovering over the location’s bar.

Click on a specific location or story to see the calculation for a specific location or story with the buttons above.

Locator map (left): 

The locator map visualizes the counties, cities, and other geographic locations that are mentioned in the Water, Texas series. By clicking on a specific county or city in the map, you will be able to examine the population of that area. 

If you click a specific city or county on the map, the visualizations will show the Texas Water Development Board’s State Water Plan data for that location. 

Water demand, supplies, and population visualization (bottom left):

This visualization has the Texas Water Development Board’s State Water Plan data for water demand, supplies, and population. 

For example, on the left side of the visualization, you will see a legend that says “population.” By clicking on this legend, you can choose what data (e.g. water demand, existing supplies, or population rates) you would like to view. 

Select a year to see the measurements of the dimensions that you chose to see it displayed on the dashboard. 
Water, Texas is a five-part series on the consequences of the mismatch between runaway development and tightening constraints on the supply and quality of fresh water in Texas. Funded by the Cynthia & George Mitchell Foundation.

Written by, Keith Schneider 

Photography:
Brian Lehmann

Data Visualizations:
Claire Kurnick

Joe Warbington – Vizlib

Pablo del Cerro – T Maker

Greg Anderson – Alias Analytics

© 2020 Circle of Blue – all rights reserved
Terms of Service | Privacy Policy

Donate to Circle of Blue
Scroll to top

This site uses cookies. By continuing to browse the site, you are agreeing to our use of cookies.

OKLearn more

Cookie and Privacy Settings

How we use cookies

We may request cookies to be set on your device. We use cookies to let us know when you visit our websites, how you interact with us, to enrich your user experience, and to customize your relationship with our website.

Click on the different category headings to find out more. You can also change some of your preferences. Note that blocking some types of cookies may impact your experience on our websites and the services we are able to offer.

Essential Website Cookies

These cookies are strictly necessary to provide you with services available through our website and to use some of its features.

Because these cookies are strictly necessary to deliver the website, you cannot refuse them without impacting how our site functions. You can block or delete them by changing your browser settings and force blocking all cookies on this website.

Google Analytics Cookies

These cookies collect information that is used either in aggregate form to help us understand how our website is being used or how effective our marketing campaigns are, or to help us customize our website and application for you in order to enhance your experience.

If you do not want that we track your visist to our site you can disable tracking in your browser here:

Other external services

We also use different external services like Google Webfonts, Google Maps and external Video providers. Since these providers may collect personal data like your IP address we allow you to block them here. Please be aware that this might heavily reduce the functionality and appearance of our site. Changes will take effect once you reload the page.

Google Webfont Settings:

Google Map Settings:

Vimeo and Youtube video embeds:

Make an impact this #GivingNewsDay
For a limited time, NewsMatch will match your gift, dollar for dollar
Journalism with this kind of impact is free to consume but costly to produce.
Support fact-based journalism with your tax-deductible donation
Support Independent Journalism
You have the power to inform the world's most important decisions
with your tax-deductible donation
 Tweet
 Copy
 E-mail
 Tweet
 Copy
 E-mail
 Tweet
 LinkedIn
 Copy
 E-mail