Study: U.S. Water Utility Revenue Growth Slows Down in Recent Years
Data from a major study of the financial health of U.S. water utilities.

Water utility experts are concerned about two converging trends: the rising cost of repairing, upgrading and replacing America’s water infrastructure and a potential decline in water utility revenues, which coincides with a drop in consumption. (Most utility revenue comes from selling water.)
Higher costs – not only for repairs, but for energy, treatment chemicals, and labor, too – and less cash to pay for them would be a troublesome mix for any utility wishing to provide reliable service.
Yet the problem with this notion about free-falling revenues is a lack of information. Many claims are anecdotal or based on small samples.
An ongoing study of water utility finances is rectifying that. The Environmental Finance Center (EFC) at the University of North Carolina, Chapel Hill and water consultancy Raftelis have put together a broad data set and found a few surprising conclusions about revenues.
“It’s kind of difficult to find centralized data,” Shadi Eskaf, EFC senior project director, told Circle of Blue. “You would think every state would have this.”
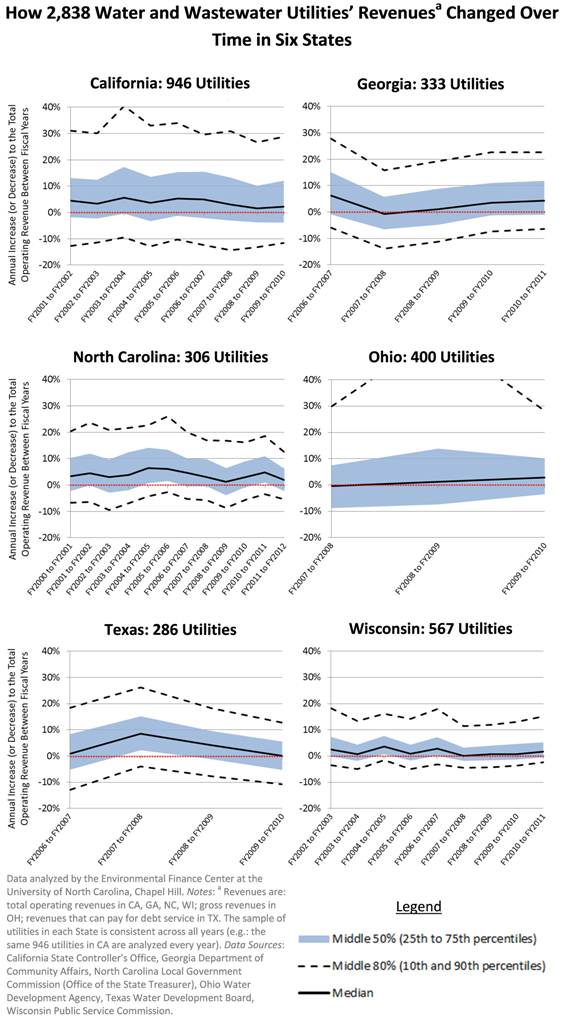
Eskaf and his colleagues looked at six states that do. With funding from the Water Research Foundation and the Environmental Protection Agency, they gathered data submitted to state agencies from 2000 to 2012 from 2,838 water utilities in California, Georgia, North Carolina, Ohio, Texas, and Wisconsin. They chose these six because they have different regulatory systems, different governance models, and are located in different regions of the country.
The research team found that, while revenues generally are not decreasing, they are growing more slowly. As Eskaf concluded, in an EFC blog post:
“In all of the states, the median change to operating revenues was almost always zero or positive, regardless of year. This indicates that, from year-to-year in the past decade, operating revenues for at least half of the utilities increased, despite a downturn in the economy, severe droughts and changes to customer water use patterns…Based on these results, it is clear that water utilities experienced at least a slowdown of revenue increases in recent years, if not actually declining revenues. Costs continue to rise in the meantime, leaving utilities with fewer resources to put into infrastructure replacement and renewal than in previous years.”
Revenues, however, do fluctuate. In the study period, between 16 and 52 percent of systems saw a drop in operating revenue from one year to the next. The biggest declines came during the recession in 2008-2010.
The revenue data set is just one part of a larger EFC/Raftelis study for the Water Research Foundation on water utility finances. That study, Eskaf said, will include sections on water rates and rate structures, on how different rate structures help or hinder financial performance, and on risks to utility revenues.
Brett writes about agriculture, energy, infrastructure, and the politics and economics of water in the United States. He also writes the Federal Water Tap, Circle of Blue’s weekly digest of U.S. government water news. He is the winner of two Society of Environmental Journalists reporting awards, one of the top honors in American environmental journalism: first place for explanatory reporting for a series on septic system pollution in the United States(2016) and third place for beat reporting in a small market (2014). He received the Sierra Club’s Distinguished Service Award in 2018. Brett lives in Seattle, where he hikes the mountains and bakes pies. Contact Brett Walton


Leave a Reply
Want to join the discussion?Feel free to contribute!