Map: California’s Water Use Per County (1985-2005)
In 2005, utilities supplied water to 92 percent of Californians, compared with 86 percent nationally, according to the U.S. Geological Survey. Water delivered to California homes, though, barely made up 9 percent of the state’s total water withdrawals. Most of California’s fresh water was directed to agriculture.
As is the case globally, farms are California’s biggest water users, accounting for more than half of total water withdrawals. Nearly one-third of the 2005 withdrawals occurred in eight southern farming counties — Fresno, Kern, Kings, Madera, Merced, San Joaquin, Stanislaus, and Tulare — that rely heavily on the San Joaquin Delta for water supplies. Also called the Central Valley, this region is home to 3.7 million people, or only 10 percent of the state’s total population, and 5 million acres of irrigated crops, which is more than half of California’s total irrigated acreage.
The land is a wellspring of employment. Whereas jobs in agriculture, forestry, fishing, hunting, and mining made up only 2.4 percent of the state’s total jobs in 2010, the figure was closer to 12 percent in the eight counties, according to the most recent Census.
It is well documented, however, that water quality in this region is poor, and so are its citizens. While 21.5 percent of California households fell at or below the poverty threshold of about $US 25,000 in annual income in 2010, all of these eight counties fared worse — upwards of 30 percent of residents in Fresno County, for instance. Children in the eight counties were most at risk. Between 27 percent and 39 percent of children in the region lived below the poverty line, compared to just 22 percent at the state level.
In other measures of well-being, Central Valley residents fared worse than the average Californian. Central Valley residents were about 10 percent less likely to have graduated from high school, and they were 14 percent less likely to have graduated from a four-year college. The 2010 median household income in the eight Central Valley counties was $US 46,000, or $US 13,700 less than the statewide median income. On average, the unemployment rate was 1.5 percent worse here than in the rest of the state.
The relationship between the region’s poverty and its largely unsuccessful work in Sacramento, the state’s capital, and in county seats to improve the region’s drinking water have been documented for decades. With Choke Point: Index, Circle of Blue clarified the links using large data sets, or what’s commonly called “big data.” Our team gathered data from a multitude of sources — federal, state, localized non-profit agencies — and built the visualizations below.
Click the image below to launch an interactive Google Fusion Tables map that shows data on California water withdrawals by county from 1985 to 2005. Click a county to learn more about the breakdown of its water use into domestic, industrial, and agricultural categories. The eight counties that rely on the San Joaquin Delta are bordered in light blue; click on these counties to learn more about the region’s population demographics and arsenic contamination. (Data gathered from Census, U.S. Geological Survey, and California Department of Public Health.)
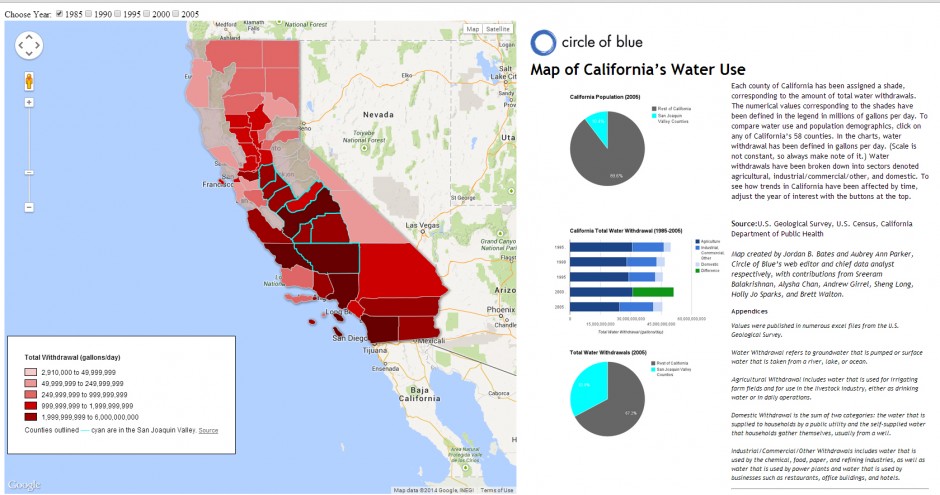
Infographic: California’s water withdrawals from 1985 to 2005, as well as information on population demographics and arsenic contamination in the Central Valley. Map © Jordan B. Bates and Aubrey Ann Parker / Circle of Blue. Click image to enlarge.
Click image to launch the interactive Google Fusion Tables map.
Domestic Public Supply
Between 1985 and 2005, domestic withdrawals from California’s public utilities increased from 3.2 billion gallons per day to nearly 4 billion gallons per day. Meanwhile, California’s population that was hooked up to the public supply increased by about 10 million people in just two decades. In other words, though there was an overall increase in withdrawals, the average Californian became more water efficient, decreasing daily domestic per capita withdrawals from 133 gallons per person per day to 119.
However, the same trend does not hold for the eight Central Valley counties, which added more than 1 million people to the domestic public supply between 1985 and 2005. Domestic water use from public utilities increased from more than 350 million gallons per day to nearly 600 million gallons per day. In 1985, daily per capita water use was already higher than the state average — 171 gallons per person per day — and this had increased to 187 gallons per person per day by 2005.
Irrigation
In California, consistently about one-third of irrigation withdrawals are from groundwater supplies. Though the state’s irrigation intensity has decreased by about 15 percent — from about 3,200 gallons per acre per day in 1985 to about 2,700 in 2005 — this is still well above other agricultural regions of the country.
More than 50 percent of the entire state’s irrigated acreage is found within the eight counties that are reliant on the San Joaquin Delta. Though the types of irrigation may have changed over the past two decades, the amount of California land that is irrigated has only decreased by 5 percent, from about 9.6 million irrigated acres in 1985 to just over 9 million in 2005, about 5 million of which are found within the eight Central Valley counties.
Arsenic Contamination
Arsenic is a toxic element that is both naturally occurring in the Earth’s crust and artificially produced from agricultural and industrial processes. In 2001, the U.S. Environmental Protection Agency lowered the arsenic standard for drinking water from 50 parts per billion to 10 ppb. At the time, there were 3,000 water systems serving 11 million people that were in violation.
A decade later, there were nearly 1,000 water systems serving 1.1 million people that were still not in compliance, and California was the state with the most violators. In 2010, California had 144 systems that were not in compliance, affecting nearly 450,000 people. Arsenic can enter groundwater sources from rock erosion, mining activity, volcanic eruptions, or forest fires. When contaminated groundwater is used to irrigate fields, arsenic can accumulate in soil and crops, entering surface water through runoff. Between 2006 and 2013, more than 30,000 tests for arsenic were performed at 11,000 sites in more than 4,600 unique water systems within the Central Valley, according to data from the California Department of Public Health. Some sites were tested multiple times per year, while others were tested sporadically.
This map was created by Jordan B. Bates and Aubrey Ann Parker, Circle of Blue’s web producer and chief data analyst, respectively. Contributors included Holly Jo Sparks and Brett Walton of Circle of Blue, with assistance from Sreeram Balakrishnan of Google Fusion Tables; Sheng Long and Alysha Chan, graduate students with the Columbia Water Center in New York City; and Andrew Girrell, a freelance data analyst who is based in Traverse City, Michigan. Columbia interns were overseen by Upmanu Lall and Margo Weiss. Reach Circle of Blue’s data team at circleofblue.org/contact and circleofblue.org/contact.
Choke Point: Index is produced in collaboration with Google Research, Qlikview, and the Columbia Water Center, with financial support from the Rockefeller Foundation.
is a Traverse City-based assistant editor for Circle of Blue. She specializes in data visualization.
Interests: Latin America, Social Media, Science, Health, Indigenous Peoples




Leave a Reply
Want to join the discussion?Feel free to contribute!