Depending on the amount of oxygen in the samples the lids of the vials on the rollers facing the camera will look red or green in the dark lighting, Laan said. The levels of oxygen suggest how much respiration is happening in the river corridor. Photo: Grace Finnell-Gudwien
By Grace Finnell-Gudwien
Bre Waterman wades into the flowing Missouri River near the town of St. Joseph on the Kansas-Missouri border. The University of Kansas graduate student collects river water in a dark brown plastic container about the size of a ketchup bottle. She also gathers sediment from the river floor, scooping the wet mud into 5-inch long test tubes. After collecting 16 samples, Waterman carefully packs up all the materials along with ice packs into a dented cardboard box, tapes it shut, and mails it across the country to Richland, Washington.
Waterman is a participant in the Worldwide Hydrobiogeochemical Observation Network for Dynamic River Systems (WHONDRS). It’s quite a tongue twister of a title for a river corridor research project hosted by the Pacific Northwest National Laboratory in Richland. She is one of almost 100 contributors not affiliated with PNNL who collect river water and sediment samples for the project. The scientists, students, and citizens around the world applied for and received the sampling kits from the PNNL’s river corridor team, and after sampling the required materials, mailed the kits back to PNNL for analysis, said Lupita Renteria, a laboratory technician involved with WHONDRS.
Samples are pouring in from the Jordan River in Israel, the Orco River in Italy, the Nakdong River in South Korea, the Fraser River in Canada and many others. By collecting samples from around the United States and the entire world, the WHONDRS team can see how climate change and climate change-induced impacts, such as wildfires and increased carbon dioxide emissions, are affecting rivers in different parts of the world.
To ensure global samples are consistent, the river corridor team double checks that every WHONDRS kit mailed out has the same materials and instructions. “It’s all very specific… no matter where they are, they have the same thing,” Renteria said. The team includes extras of materials as well in case the participant breaks something.
The team also places inventory control labels on all of the collection materials to see which locations materials are coming back from and when. That way, they can keep tabs on which materials are still in the field with participants.
“We really try to account for just about everything,” said Sophia McKever, another lab technician with the River Corridor team.
Once a participant like Waterman mails in her completed kit samples to the lab, the team has an intensive protocol for unpacking and recording data. This data is used with data from other WHONDRS kits to see how nutrients such as oxygen and carbon dioxide vary in river corridors worldwide in the midst of a rapidly changing climate.
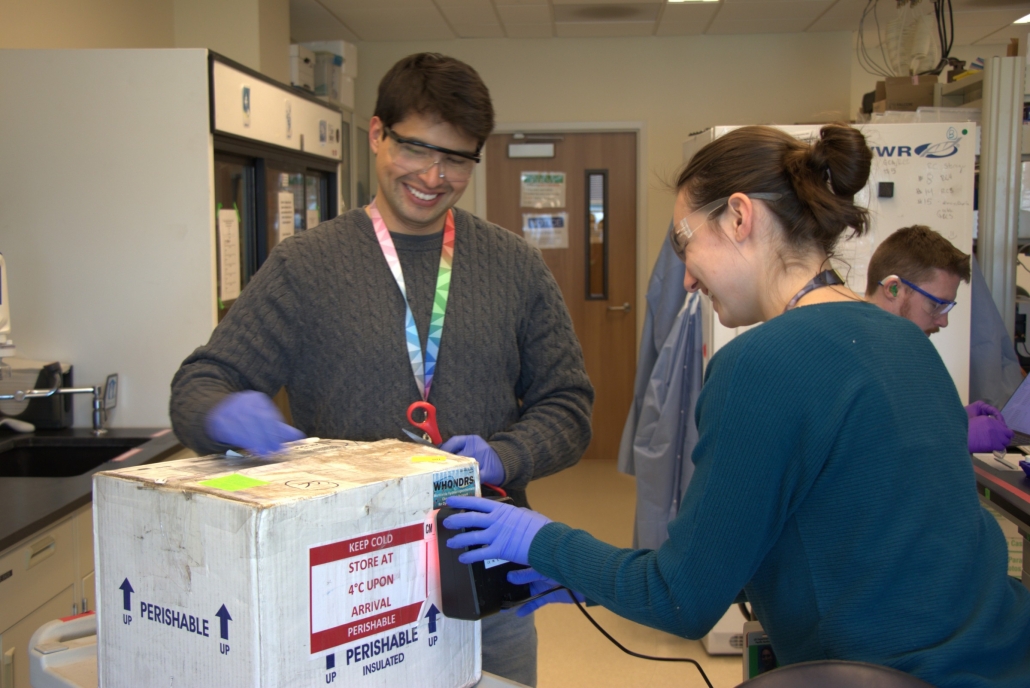
When unpacking WHONDRS kits, Dillman Delgado Paredes (left) and Maggi Laan scan the boxes and samples inside to help record data more smoothly. They and the rest of the river corridor team unpack at least one kit every week, Laan said. Photo: Grace Finnell-Gudwien
A muddy surprise: Unpacking the kits
Dillman Delgado Paredes, a post-master’s research associate, carries in the dirty white box and sets it on a plastic cart with wheels. He cuts a slit down the tape and opens the box.
“Ooooh.”
This specific box – a kit coming back from the neighboring state of Oregon – is especially dirty. The ice packs are still frozen, but one of them is leaking, and their condensation has muddied up the box by mixing with stray dirt and sediment from the field.
After the initial shock wears down, the team starts unpacking the kit. First up are two larger containers full of water. One of the containers is supposed to be filtered, the other isn’t. Both aren’t in this case, so the team will have to filter one in the lab. The team also takes the temperature of this water ? 0.5 C.
Next, the team scans the QR inventory codes to register the samples into their laboratory computer network and make sure all of the samples are present. Since the QR codes are paper stickers on the outside of the bottles, sometimes they come off and the team inputs the data manually.
As the team pulls out another gallon-sized ziplock bag, they can see into the rest of the damp box. There’s a collective groan.
“Oooh. They did not pack it very well,” said Maggi Laan, another post-master’s research associate. “Usually they look a lot nicer than this; this one is not very photogenic.”
The team asks participants to collect 16 separate samples with some types of samples requiring three vials. This means there are lots of vials and bottles for the team to unpack.
Maneuvering around some broken vials, the team continues to unpack and scan the worst kit Laan has seen in her year with WHONDRS. Along with scanning the vials, the team looks to make sure the vials are filled to the right level. If they are too full, the team will pour a little out so glass vials don’t break when frozen and the water expands. If the vials don’t have enough water, the team will note it down. Obviously, topping off the vial with tap water would ruin the sample. This kit had some vials underfilled and one overfilled – luckily even the underfilled ones were only a milliliter short.
Once all of the vials and containers are unpacked, scanned and prepped, the team divides up the analyses they need to do. Paredes sieves the ketchup-sized bottle of sediment, using a small metal spatula to push the mud through a sieve the size of a dinner plate. The participant already sieved the sediment in the field, but the team always repeats this step in the lab again. By the time he is done, the mud went from a grainy, clay-like texture to a smooth paint consistency.
The other team members subsample the other vials, separating water and sediment, filtering water, and flash freezing some with nitrogen. They record various biogeochemical properties of the water, including the pH, specific conductivity, organic matter, ions, and microbes. They also prepare vials to measure oxygen consumption.
“We receive [the kits] on Wednesdays and we subsample sediment, and we’ll measure dissolved oxygen tomorrow,” Laan said.
The group unpacks one to three kits every Wednesday, as they have for the past year. The refrigerator of the sample leftovers proves it. Laan essentially plays Tetris to find a place to put the bag of this week’s leftovers in the fridge.
“Our freezers are very full, and every week it’s tricky trying to put stuff in,” she said.
Many refrigerators in the laboratory, which is located in the Biological Science Facility at PNNL, are affectionately named after ice-type Pokémon, including Amaura, Cubchoo and Spheal. Each refrigerator holds specific samples for different analyses.
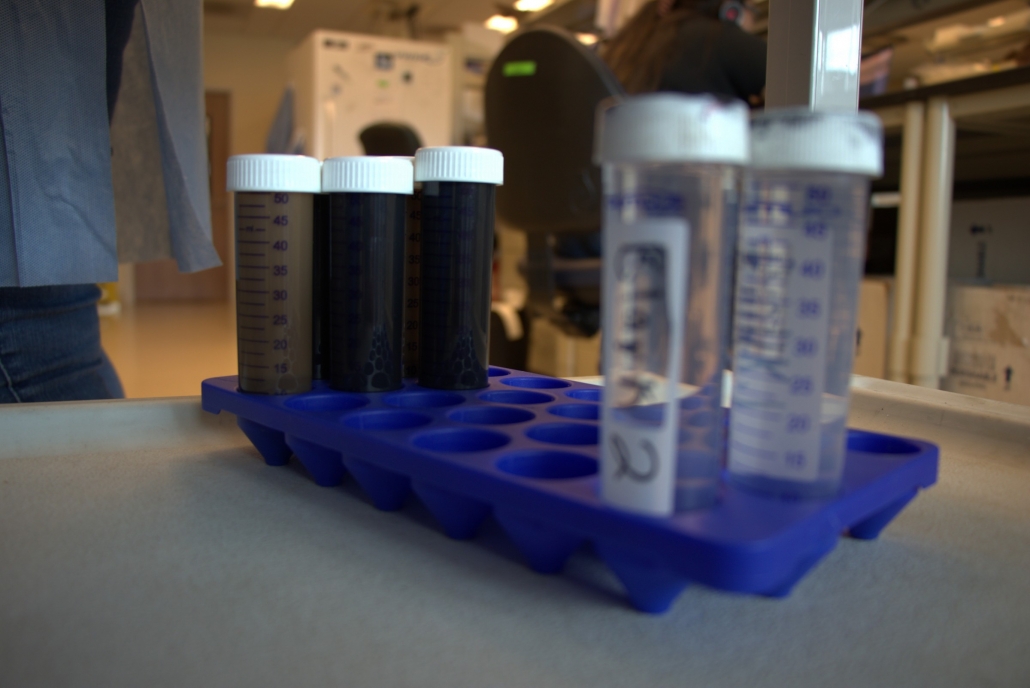
The river corridor researchers collect vials of both sediment and water to study nutrient concentrations in the rivers across the globe.. The team at PNNL assesses the samples sent in to ensure each vial has the right amount of material, Laan said. Photo: Grace Finnell-Gudwien
Dissolved Oxygen: A glimpse into carbon cycling
The next morning, the team measures the dissolved oxygen in the samples. Measuring dissolved oxygen over multiple hours will show how much oxygen is consumed by microorganisms in the water, and thus how microorganisms are producing and using carbon dioxide – especially considering higher levels of carbon dioxide absorbed in the water from the air due to fossil fuel emissions.
Measuring the dissolved oxygen of river sediment and water can help the team understand how nutrients – especially carbon – cycle between the river ecosystem and surrounding environment. This is extra important with climate change forcing the river to store increasing atmospheric carbon dioxide and face a warming planet, said Tim Scheibe, the principal investigator of the River Corridor Science Focus Area project at PNNL, which includes WHONDRS.
Microbes and plants naturally balance each other’s oxygen and carbon dioxide in a river ecosystem, Scheibe said. WHONDRS’s research can help scientists understand how humans’ additions impact this natural balance.
To measure dissolved oxygen for WHONDRS, the team adds water to the vials and blows air into the sediment and water for intervals of 20 seconds. They shake the vials for 5 seconds in between aerations. They do this in an environmental chamber that keeps the air in the room at a specific temperature and humidity, and incubate the vials here. The team then measures the oxygen in the environmental chamber and manually inputs the data in a computer. This process takes two hours.
Dissolved oxygen is an important measurement for other river corridor research as well, such as WHONDRS’s co-lead James Stegen’s Early Career Award (ECA) research project that looks at dissolved organic matter and the chemistry of rivers worldwide. The researchers measure dissolved oxygen for this project as well.
For this project, the team puts the sediment samples in 50-milliliter vials and then completely fills the vials with water, taking care to not let any air bubbles in because they have a different concentration of oxygen than the sample.
While two team members do this, Laan calibrates the oxygen sensor, which uses discs that are red or green under a blacklight depending on the amount of oxygen in the sample. Because the sensor requires a blacklight, the lab room must be dark. The team members filling the vials have to wear headlamps to see.
“It can be a little bit fast-paced on the set-up,” Laan said. “There’s a learning curve, and you have to do it in the dark.”
Once the vials are ready, the team puts the oxygen sensor disks on them, and lays the vials on rollers that spin the vials while a camera takes an image of them with the blacklight every 2 minutes. The color of the discs in the image shows how much dissolved oxygen is present.
After the team researchers measure oxygen concentration, they turn to the vials to document conductivity, temperature and iron. These variables can impact oxygen concentration so measuring them helps the team better understand why oxygen concentration might vary from location to location, said Brianna Gonalez, a technical student with the river corridor team.
“This is the part that is more time sensitive,” said Gonzalez. “We want to get it as close to the incubation [as possible].”
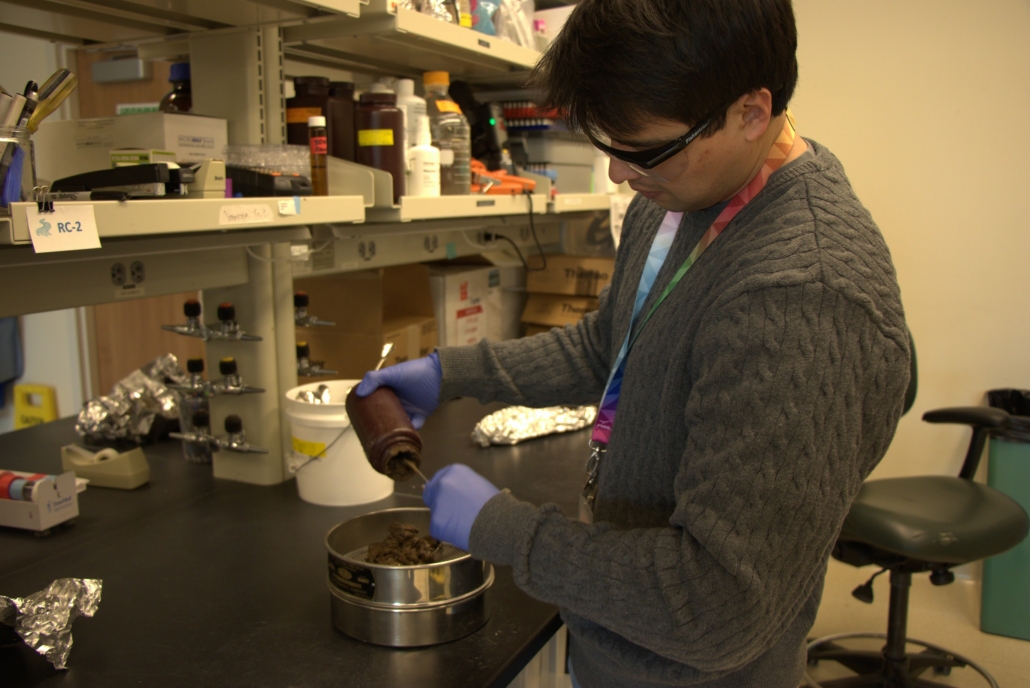
Paredes sieves the sediment collected by a participant by pushing it through a small metal filter. This sediment is used to measure nutrient concentrations in the river corridor, which gives the scientists insight into how climate change is affecting the rivers, said Tim Scheibe, the principal investigator of the River Corridor Science Focus Area. Photo: Grace Finnell-Gudwien
ModEx: A cyclical approach to research
To get a look at how nutrients cycle and how other river characteristics vary worldwide, river corridor researchers need to collect data from Africa, Europe, Asia, the Americas and other areas. As the WHONDRS project and other research in the science focus area at PNNL gather data from samples mailed in from other scientists and citizen scientists, the researchers must determine from where else in the world to collect samples. To decide this, the river corridor team uses an interactive model-experiment (ModEx) approach, said Peishi Jiang, a junior earth scientist.
To use the ModEx approach, the river corridor team uses observational data from the field and lab to calibrate models and determine ecosystems where additional data could improve the models. After defining new regions to get samples from, the researchers will go out into the field or request data from those areas.
“It’s how you want to do good science,” Jiang said, mentioning that the ModEx approach is an ‘intuitive” way to gather and apply information.
The team uses advanced and supercomputers to set up 2D and 3D process-based models depending on the variables inputted. Some of the supercomputers use 1,000 central processing units; in comparison, a regular laptop uses about 16, Jiang said.
The models the team uses consider river corridor characteristics and how climate change has impacted them, including nutrient cycles, land cover, soil types and soil porosity. A large component of the models is how wildfires impact river corridors – a major climate change impact that hits close to home at PNNL. Since fire areas are so close, the team does spend a lot of time looking at nearby areas recently impacted by fires, such as the Yakima River Basin. Inside of the larger Columbia River Basin, this 6,155-square mile watershed is in the central portion of southern Washington; PNNL is in the southeast corner of the area.
“We want to predict throughout the whole watershed,” said Bing Li, a postdoc research associate. “We see more severe wildfires in the Pacific Northwest.” He said they impact the soil the most.
To model these wildfire impacts, the team considers both the hydrological and biogeochemical processes, such as how much water is able to permeate into the soil, how nitrogen and carbon are cycling through the soil and how much leaf area and vegetation is reduced in the watershed after fires. The team also looks at how severe the fire was in the area.
When the fire is more severe, Li said, the soil becomes less permeable because it was charred. This can make the area more susceptible to flooding if it rains because the water cannot be as easily absorbed by the soil. Not surprisingly, fire dries out an area, so it also reduces leaf area.
Within the Yakima River Basin, the team also has spatial and temporal sites for their own sampling. The team does not visit the spatial sites as frequently, but they take turns in pairs to visit the six temporal sites monthly – assuming the sites are accessible. In the winter, sometimes the team is snowed out of the sites further north up in the Cascade Mountains, said McKever, who helps with sampling.
The sampling at these sites is similar to the WHONDRS kits the team mails out, Laan said. These samples involve collecting about a dozen vials and containers per site to measure pH, ions, conductivity, and other biogeochemical characteristics of the water and sediment.
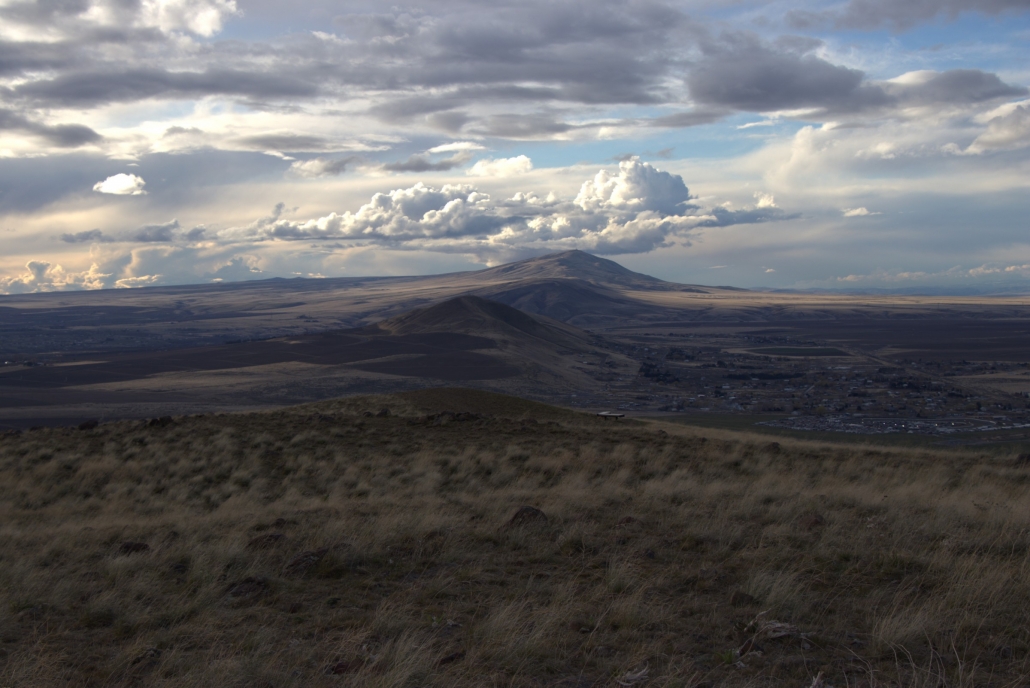
PNNL is located in Richland, Washington, in the southeast corner of the Yakima River Basin. This image is taken from the top of Badger Mountain in Richland (about a 15 minute drive from PNNL) facing northwest towards the Yakima River Basin. Photo: Grace Finnell-Gudwien
ICON: Making river corridor science accessible
Project co-lead Stegen said having worldwide data about rivers is important for everyone and that open, inclusive science is vital to do this.
“You have to have knowledge of Earth’s systems throughout the entire globe,” Stegen said, noting that PNNL’s research used to be much more local. “We evolved from there into a global research program on river corridors.”
The WHONDRS campaign follows a science framework called ICON, Stegen said. This means Integrating multiple scientific fields in their research, such as biology, chemistry, hydrology and computer science. The research must be Coordinated and consistent so others can perform the same research tasks, such as making sure the WHONDRS kits are understandable and easy to use.
Once data is recorded, Open access to it is a priority. Stegen said that the science world is experiencing an “open science revolution” right now. “Open” means the data must be clean, usable and available for everyone. So far, people from 20 countries and 60 institutions have been involved used WHONDRS data, Stegen said. You can access WHONDRS data on the WHONDRS site.
Finally, WHONDRS research is Networked. Throughout the research process, the team talks with other scientists that may have similar interests and will help with their research. For example, when the team goes to collect samples in the Yakima Watershed, sometimes they collect extra samples for other scientists, who provide their own instructions on what samples they need; McKever and Laan did this last time they sampled. This networking is a “mutual benefit” to all researchers involved, Stegen said.
“I was never taught to do science in those ways,” Stegen said. “I’ve really enjoyed coming into this environment.”
By following these principles, the river corridor research can be easily applied and transferred worldwide. Bre Waterman’s sample from the Missouri River helps look at nutrient cycling in Yakima River Basin, and both help generate models to see where to sample next. With a warming and changing climate, this interconnected research is essential for learning more about and protecting our rivers.
Grace Finnell-Gudwien is a freelance science and environment reporter. She’s also a 2023 graduate student at the Medill School of Journalism at Northwestern University.