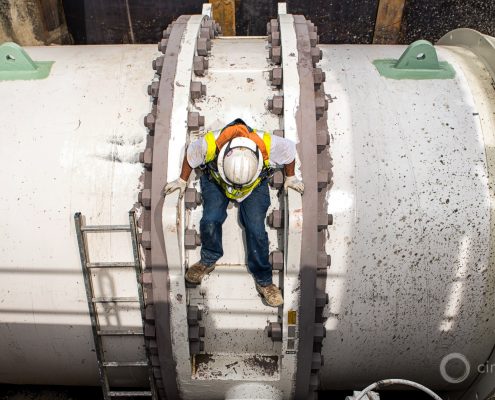
Price of Water 2017: Four Percent Increase in 30 Large U.S. Cities
Utilities test new rates, look beyond the ratepayer for revenue.
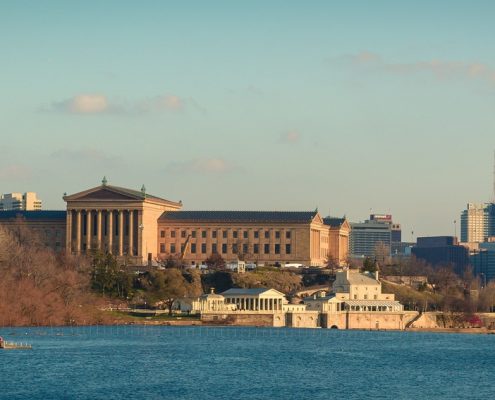
Philadelphia Water Rate Links Payments to Household Income
City utility prepares nation’s first water rate based on annual…
California Designs First Statewide Water Affordability Program
Many questions before the program begins operating.
By…
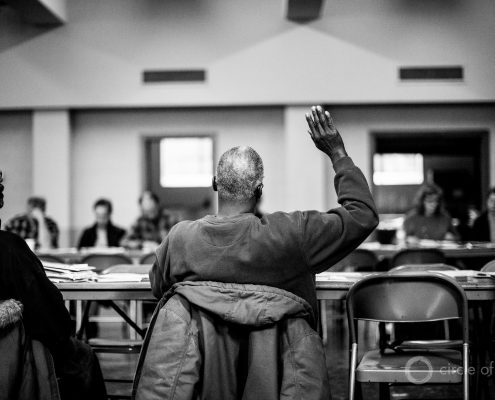
Congress Weighs Help To Pay Escalating Household Water Bills
Midwest lawmakers propose new direction for water affordability.
By…
Infographic: Average U.S. Household Water Use and Bills, 2015-16
1 Comment
/
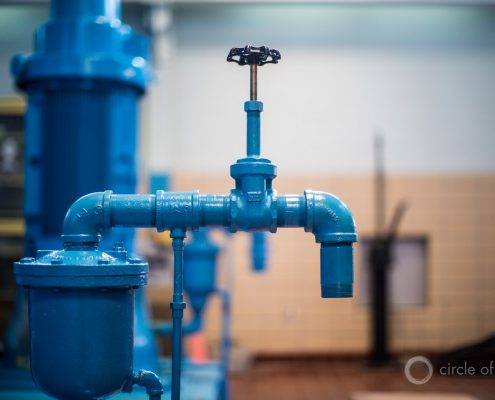
High prices do not necessarily mean high bills.
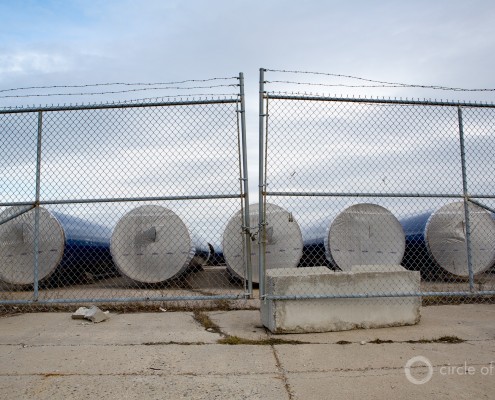
Water Systems Need Investment and Affordability
Utilities are pulled by opposing economic and infrastructure pressures.
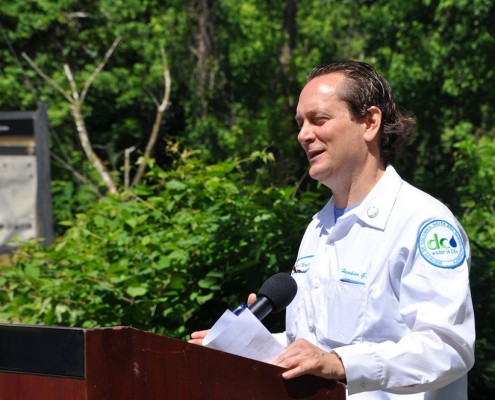
DC Water Increases Rates to Pay for New Infrastructure
Residents of the nation’s capital will pay a new fixed fee for replacing old pipes.
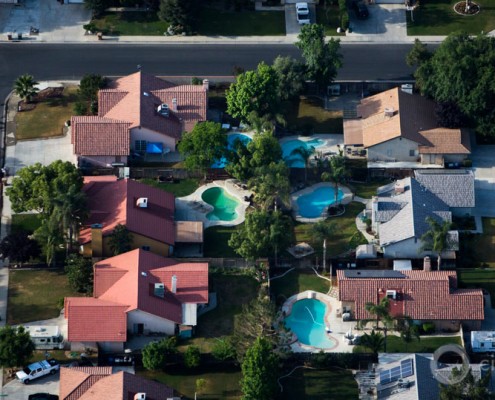
California Court, Despite Drought, Questions Popular Water Pricing Tool
Increasing block rates garner closer attention.
Photo ©…
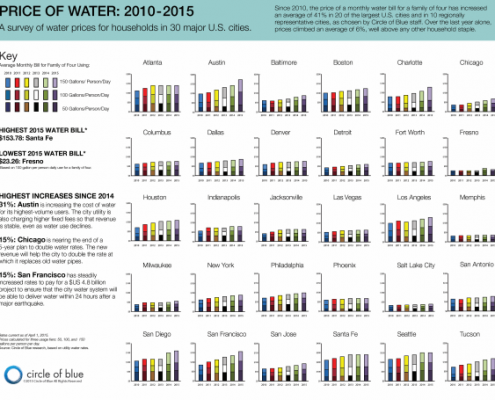
Infographic: Price of Water in 30 Major U.S. Cities (2010-2015)
Cities raise rates to pay for repairs and to respond to conservation.
The…
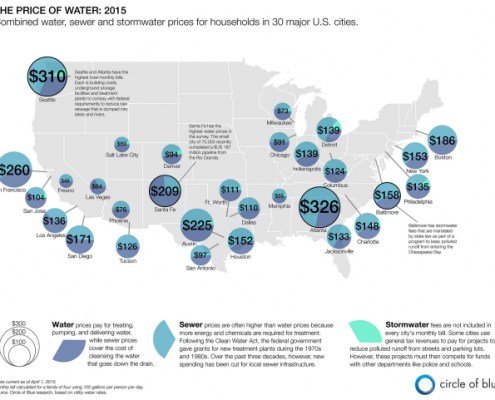
Infographic: 2015 Price of U.S. Water, Sewer, and Stormwater
Map of the cost of water service in 30 major U.S. cities.
The…
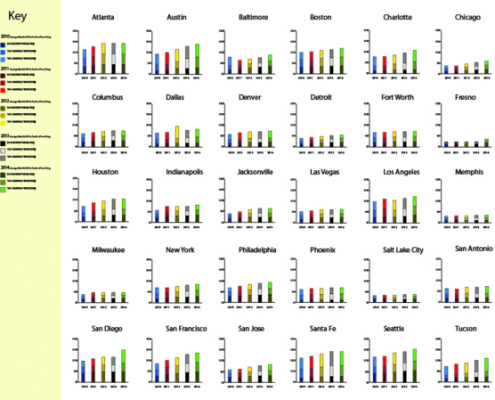
Price of Water 2014: Up 6 Percent in 30 Major U.S. Cities; 33 Percent Rise Since 2010
Water scarcity and successful conservation programs force…
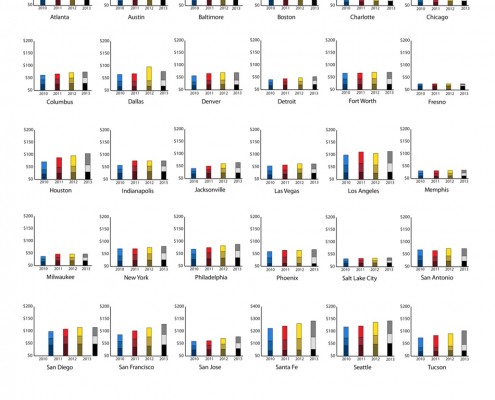
The Price of Water 2013: Up Nearly 7 Percent in Last Year in 30 Major U.S. Cities; 25 Percent Rise Since 2010
Utilities tinker with rate structures designed to stabilize revenue.

