Infographic: Average U.S. Household Water Use and Bills, 2015-16
High prices do not necessarily mean high bills.

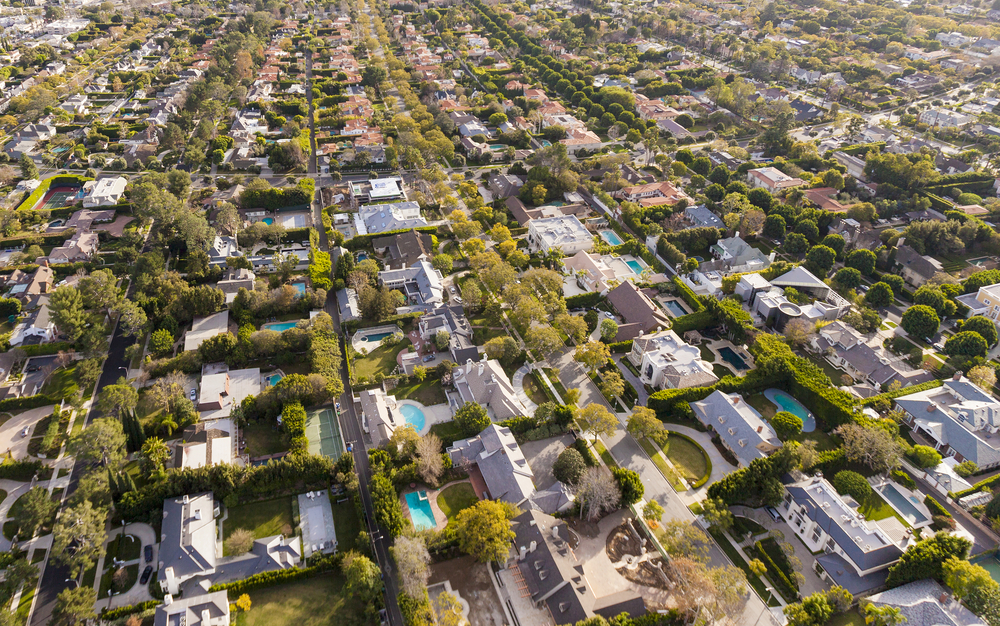
Household water use varies significantly in the largest cities in the United States. Photo © J. Carl Ganter / Circle of Blue
By Brett Walton, Circle of Blue
A water bill is a combination of two variables: price and use. By conserving, residents can lower their bill, much like driving less reduces gas expenditures.
The interactive chart below shows average household water use and average monthly drinking water bills for the 30 U.S. cities in Circle of Blue’s annual water pricing survey. Point the cursor at a city to see its data. The red dots represent water use and the blue bars show the average monthly bill.
High prices do not necessarily mean high bills. Seattle and San Francisco have two of the most expensive rates in the survey, but average bills are comparable to other cities because residents use very little water, less than 4,000 gallons (15,140 liters) per household per month. Phoenix residents, on the other hand, use twice as much water per month and still have a lower average bill. Urban density, climate, and price are all factors in residential water use.
A note on the data: Circle of Blue asked utilities for median household water use. Not all utilities had median data — only Denver, Phoenix, Tucson, and Seattle provided it. The rest provided average use or “typical use,” as defined by the utility.
Brett writes about agriculture, energy, infrastructure, and the politics and economics of water in the United States. He also writes the Federal Water Tap, Circle of Blue’s weekly digest of U.S. government water news. He is the winner of two Society of Environmental Journalists reporting awards, one of the top honors in American environmental journalism: first place for explanatory reporting for a series on septic system pollution in the United States(2016) and third place for beat reporting in a small market (2014). He received the Sierra Club’s Distinguished Service Award in 2018. Brett lives in Seattle, where he hikes the mountains and bakes pies. Contact Brett Walton


Trackbacks & Pingbacks
[…] American households spent, on average, $15-$77 a month for water, according to the research group Circle of Blue, which focuses on environmental […]
Leave a Reply
Want to join the discussion?Feel free to contribute!