Posts

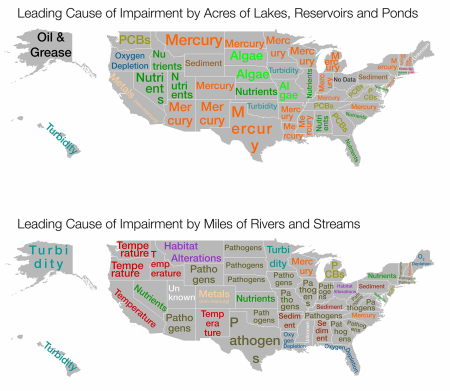
Infographic: U.S. Surface Water Pollution by State
1 Comment
/
More than half of the country's lakes and rivers are not meeting water quality standards.

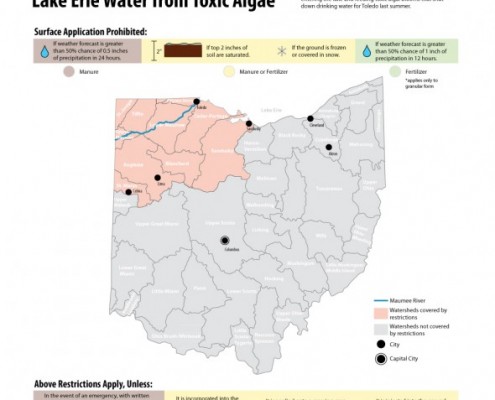
Infographic: Ohio Passes Farm Regulations to Stop Lake Erie Toxic Algae
Ohio passes its first regulations on farm practices and wastewater discharges since the Toledo drinking water crisis eight months ago.

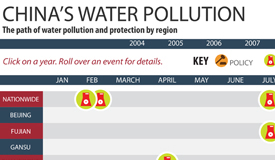
Infographic: China’s Water Pollution Events and Protection Policies (2004-2011)
China has some of the dirtiest and most dangerous water in the world. This detailed and interactive timeline shows key pollution events, protests, and policy reforms from the last eight years at both the national and regional levels as China tries to clean up its act.

Infographic: Successes and Failures of China’s Five-Year Plans (1996 -2010)
A breakdown of previous plans gives context to the newly released 12th Five-Year Plan.

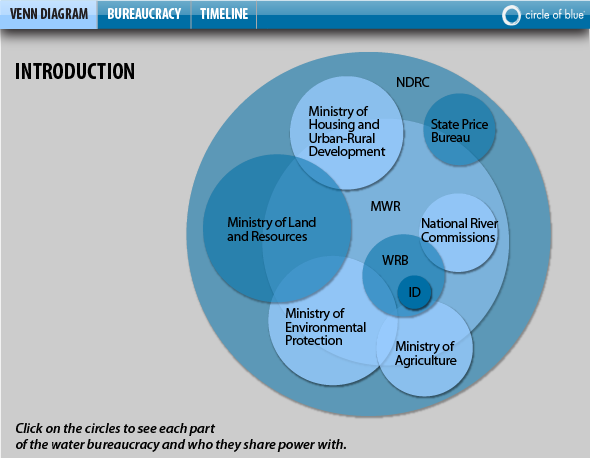
Infographic: China’s Water Governance Bureaucracy and Water Legislation Timeline
Demystifying China's governmental water offices and water-related…

Infographic: State Legislatures Bridge Water-Energy Gap
A look at 16 states with statutes that acknowledge the tightening chokepoint between declining water resources and rising energy demand.

