Watching World Droughts and Food Stocks
The world food situation isn’t looking good right now.
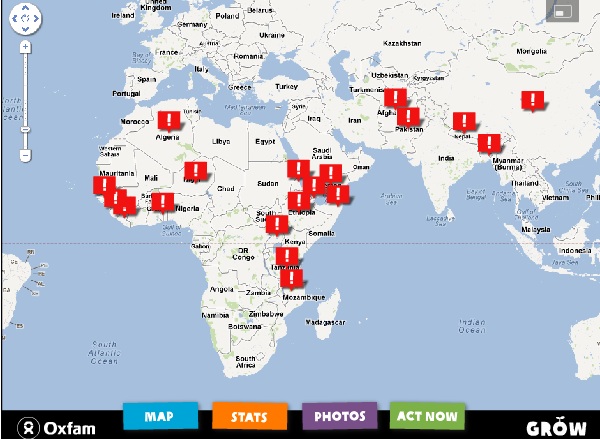
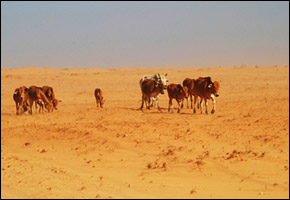
Beyond the crippling drought in the Midwest United States, the world’s largest corn exporter, droughts are squeezing agricultural production in Italy’s Po River delta and continue to cause food insecurity in the Horn of Africa (more on that coming up soon at Circle of Blue.)
Furthermore, the poor performance of monsoon rains is pushing India toward drought. India relies on the monsoon rains to feed more than 50 percent of its agricultural land, and some reports suggest that the world’s second most populous country might have to dig into grain stockpiles to shore up food supplies next year. Again, look for a story in the next few weeks about how drought could impact India’s food production.
With some of the world’s biggest food producers under water stress, food prices are already on the rise—corn prices, for example, have jumped 27 percent in July alone. The World Bank recently said it is concerned about the effect these price increases will have on the world’s poor, who are disproportionately impacted by food price volatility.
I have been tracking food insecurity and droughts around the world for Circle of Blue, so you can check out some of my previous stories on the United States, Africa’s Sahel region, and Argentina. Also, look at this really neat story by my colleague, Brett Walton, about how the U.S. Drought Monitor is created each week.
Are you concerned about the world’s food supply and how it is impacted by drought? Have a drought story or pics to share? I would love to hear from you! Contact Codi Yeager
–Codi Yeager-Kozacek
Reporter, Circle of Blue
A news correspondent for Circle of Blue based out of Hawaii. She writes The Stream, Circle of Blue’s daily digest of international water news trends. Her interests include food security, ecology and the Great Lakes.
Contact Codi Kozacek


Leave a Reply
Want to join the discussion?Feel free to contribute!