
The price of water can be influenced by the supply sources and systems, in addition to the number of users who are sharing these water resources and the burden to pay for the supply system’s maintenance.
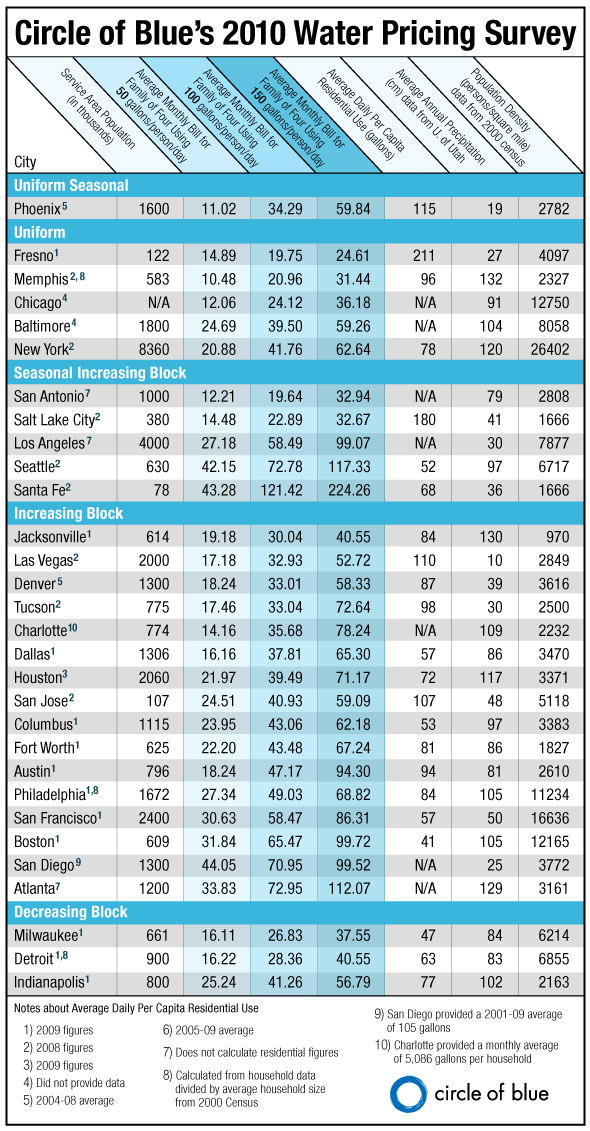
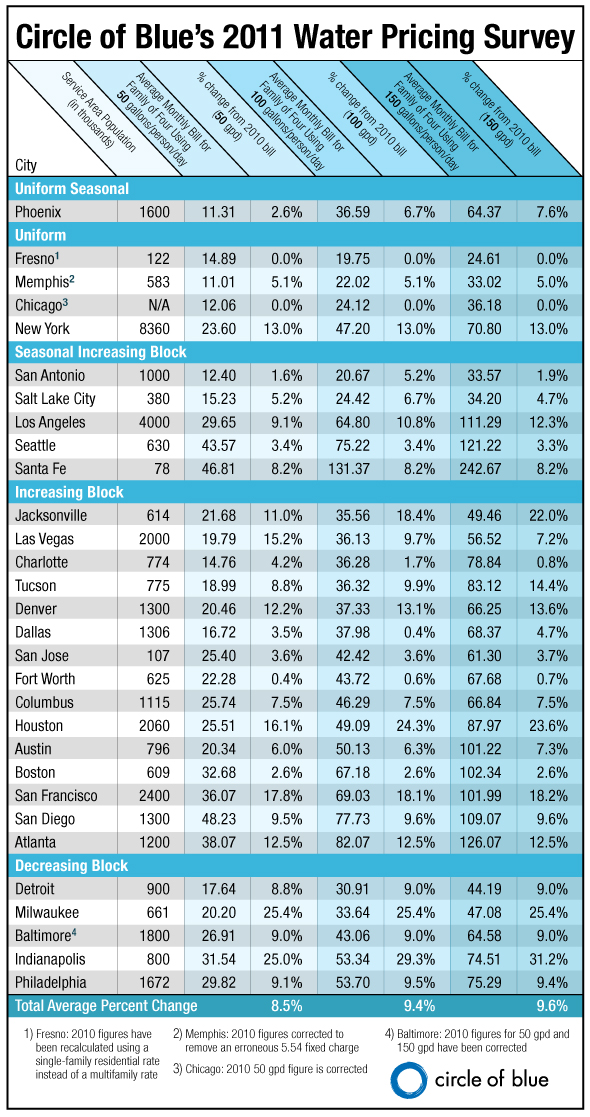
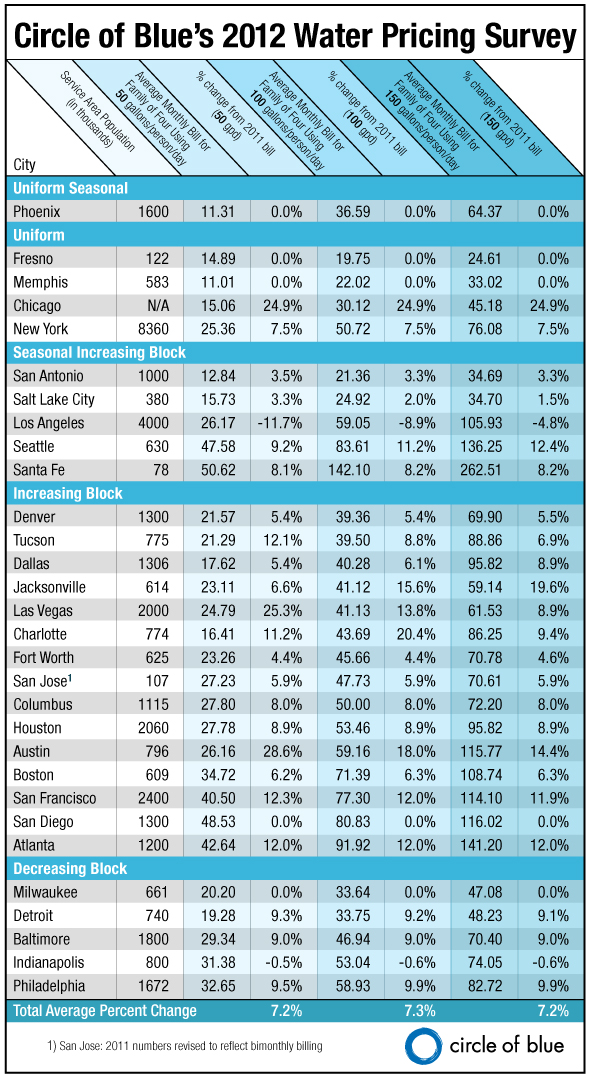
The charts below show the price of water in 2010, 2011, and 2012 for the 20 largest U.S. cities, plus 10 regionally representative cities, as well as the number of users in each city’s service area.

|

|

|
The survey does not measure an average bill, but, rather the cost of a constant volume of water across the nation’s major metropolitan areas — monthly water bills were calculated for a family of four at three daily consumption levels: low (190 liters or 50 gallons per person per day), medium (378 liters or 100 gallons), and high (568 liters or 150 gallons).
In other words, if a family of four were to move from city to city, but kept its consumption patterns the same, this is what that family would expect to pay for its water bill. The graphic below shows the rate changes in 30 major U.S. cities from 2010 to 2012.

Amanda Northrop is an undergraduate student at Grand Valley State University and a Traverse City-based design intern for Circle of Blue. This infographic was made to accompany an article written by Circle of Blue reporter Brett Walton: The Price of Water 2012: 18 Percent Rise Since 2010, 7 Percent Over Last Year in 30 Major U.S. Cities. Reach Northrop at circleofblue.org/contact.
