

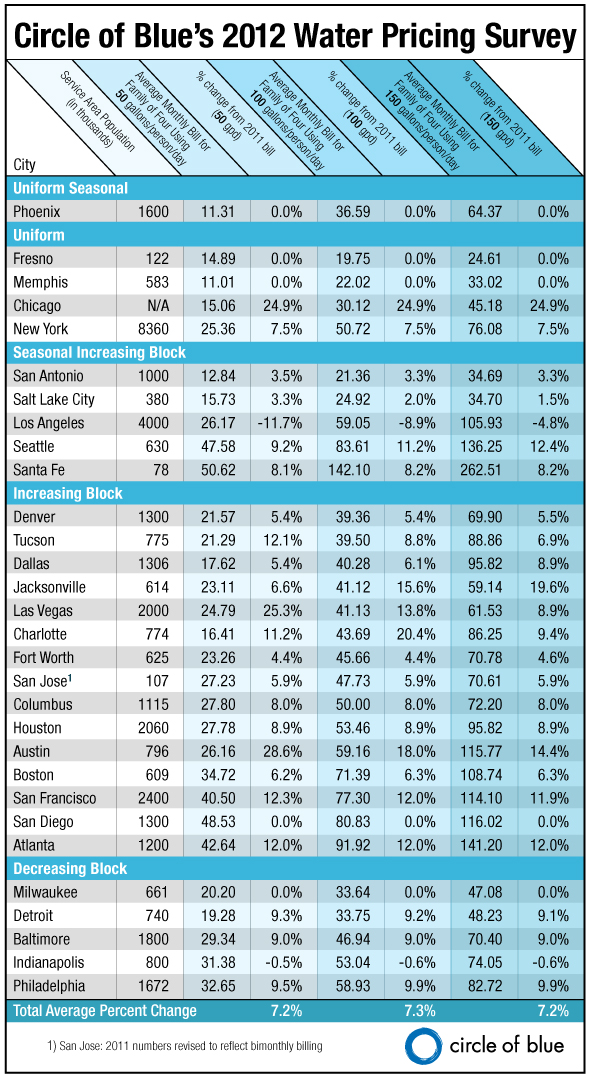
Rates have increased in many cities, but local conditions dictate by how much and how the increase is distributed. Chicago prices are up nearly 25 percent, while Los Angeles is down by 9 percent.

By Brett Walton
Circle of Blue
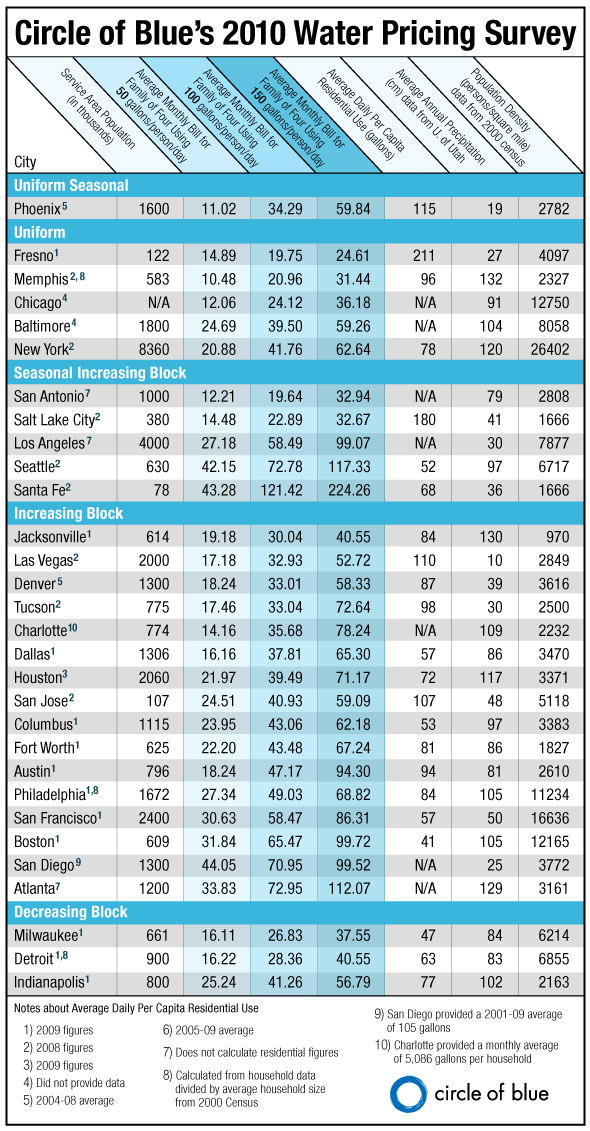
Reflecting economic circumstances for water utilities in countless American cities and towns, single-family residential water prices in 30 major U.S. cities have gone up an average of 7.3 percent during the last year and 17.9 percent since 2010, when Circle of Blue began collecting pricing data. The median increase was 7.8 percent over the last year.
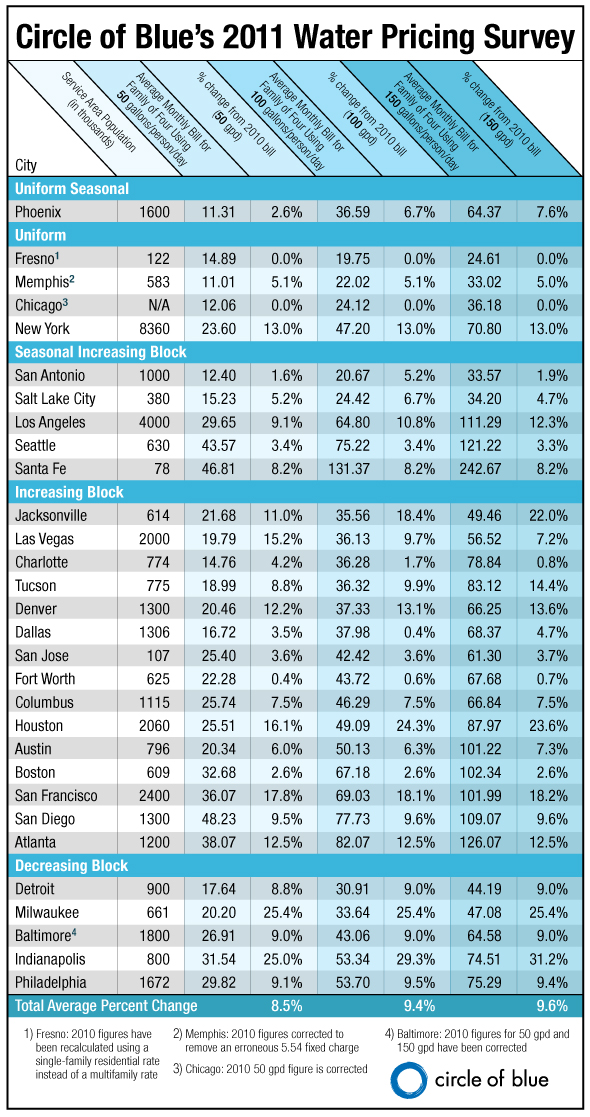
Circle of Blue began tracking water rates in 2010 for the same 30 U.S. cities: the 20 largest in the nation, plus 10 regionally representative cities. From 2010 to 2011, the first year an annual comparison was possible, prices rose an average of 9.4 percent, with a median increase of 8.6 percent.
These figures are based on “medium consumption,” which is defined as a family of four using 378 liters (100 gallons) per person per day — roughly the national average for daily per capita domestic water use, as calculated by the U.S. Geological Survey.
After seeing no increase from 2010 to 2011, Chicago residents have this past year faced the steepest rate increase: 24.9 percent across all consumption levels. The city is raising funds to replace 1,450 kilometers (900 miles) of its water distribution network, part of a $US 1.4 billion investment in its water and sewer systems.

In Los Angeles, by contrast, medium-volume users paid almost 9 percent less than a year ago, seeing only a 1 percent increase since 2010. Because the city needed to buy less water from the regional wholesale provider, the Los Angeles Department of Water and Power actually decreased its residential rates in 2011. However, the utility estimates that customers will pay 3.2 percent more over the next year, after an increase in the water quality charge, which took effect April 1.
Local Conditions Influence Rate Decisions
Rate increases, however, do not necessarily lead to higher bills. Aneesh Prabhu, a credit analyst at Standard and Poor’s notes that water rates are much higher in Europe. Still, because they use less water, Europeans end up paying roughly the same amount each month as American households, he said.
The amount that Americans pay for water is rising faster than U.S. inflation and faster than the amount paid to any other utility service — be it gas, electricity, or telephone charges — according to the Institute of Public Utilities at Michigan State University, which looked at data from the Bureau of Labor Statistics.
Only garbage collection and cable television track alongside water price increases.
Though the trend is national, local conditions dictate the nature of these increases. Three cities in Circle of Blue’s survey — Las Vegas, Austin, and Charlotte — put new “fixed” fees in place during the last year. These are charges that are paid every month, no matter how much water is consumed.
The Southern Nevada Water Authority (SNWA), the regional wholesale provider to roughly 2 million people in the Las Vegas area, previously relied on connection fees associated with new homes to provide a significant share of its budget for capital projects. In 2005, near the peak of the region’s growth rate, SNWA approved the construction of a third water-intake pipe into Lake Mead, a project that now costs $US 800 million.
 |
 |
 |
But since then, the housing bubble burst, the national economy went into recession, and people have stopped moving to Las Vegas. As a result, revenue from connection charges have fallen dramatically, from $US 188 million in 2007 to only $US 3.2 million in 2010.
A new $US 5.00 monthly fee for most residential households is expected to pull in $US 97 million per year, said SNWA spokesman Scott Huntley.
A Rate Makeover
Economic recession and a stagnant customer base certainly crimp revenue, but water conservation, drought restrictions, and the whims of weather can curb water use and affect balance sheets.

These circumstances expose a structural problem with utility water rates: most costs — such as debt payments — are fixed, but most of the money to pay for them comes from charges on water use, which fluctuates every year.
It is not uncommon for a water utility to have a budget with 80 percent fixed costs and 20 percent that are variable, but, at the same time, to have a revenue stream that is the mirror opposite: 80 percent variable (based on water use, which goes up and down) and 20 percent fixed (in the form of standard monthly charges).
For Austin Water in Texas, however, that proportion has tipped even farther to one side. Until last year, nearly 90 percent of Austin Water’s revenue was variable. When an unusually wet 2010 poured buckets on the Texas capital and residents did not need to water their lawns as much, the utility saw revenues drop by 13 percent.
To rebalance the books, Austin Water, which serves nearly 800,000 people, put in place a new $US 4.40 monthly fixed fee last November. David Anders, the utility’s assistant director, told Circle of Blue that the goal is to increase fixed revenues from 10.5 percent of total revenue to 17 percent. Future changes to the rate structure will move the utility closer toward the 20 percent threshold.
In Charlotte, meanwhile, wet weather is also partly to blame for several drops in revenue over the last decade. In response, the city’s water utility is moving more of its water charges into fixed fees in order to avoid the variability that comes from relying on consumption.
Charlotte’s monthly $US 2.25 “availability” fee is designed to cover 20 percent of capital projects, said spokeswoman Karen Whichard.
Several cities in the survey, including Milwaukee, did not change their rates after large increases in recent years. Others are in the middle of planned, multi-year rate increases to pay for system improvements (Atlanta) or new water supply projects (Santa Fe).
Yet, rates alone do not provide a full picture of a utility’s finances. Some cities, such as Atlanta, levy a sales tax that contributes to water department revenue, and others operate overlapping water and sewer budgets.
Circle of Blue gathered water rate information from the Web site of each city’s water utility or from phone calls or emails to the utilities. Prices are based on single-family residential rates and are current as of April 1, 2012. Average monthly prices for cities with seasonal rates were calculated using seasonal weighting. The fixed fees cited in the article are for 5/8 inch meters, the most common size for residential connections.
Amanda Northrop is an undergraduate student at Grand Valley State University and a Traverse City-based design intern for Circle of Blue. Reach her at circleofblue.org/contact. Kalin Wood was a design intern for Circle of Blue during the summer of 2010, when the water pricing story was first released.
