

Because of costlier inputs and infrastructure replacement, rate experts predict prices will only go higher.
By Brett Walton
Circle of Blue
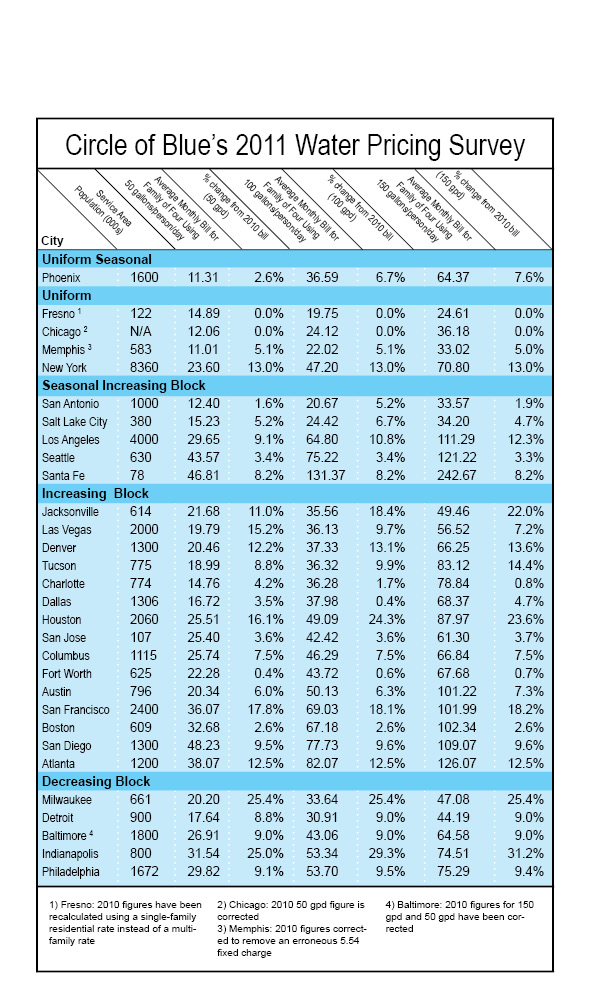
In the last year, the price of water in 30 U.S. metropolitan areas has increased an average of 9.4 percent for residential customers with medium consumption levels, according to data collected by Circle of Blue. The median increase for medium consumption was 8.6 percent. Water rates for high-volume consumers have increased slightly more than rates for lower consumption—an indication that utilities may be attempting to curb water use by charging higher marginal rates.

The annual survey, which Circle of Blue first conducted in April 2010, charts what residents pay per month for water in the 20 largest U.S. cities, as well as 10 regionally representative cities.*
Monthly water bills were calculated for a family of four at three consumption levels:
- Low: 50 gallons per person per day (6,000 total gallons per month)
- Medium: 100 gallons per person per day (12,000 total gallons per month)
- High: 150 gallons per person per day (18,000 total gallons per month)
Since the prices depend on cost-of-service factors and revenue decisions unique to each utility, comparisons between cities are somewhat difficult at first glance. However, the broader trend is unmistakable: the price of water is going up.
Over the last year, the largest relative rate increases occurred in Indianapolis (29.3 percent increase at medium consumption), Milwaukee (25.4 percent), and Houston (24.3 percent).
Water prices in two cities—Fresno and Chicago—have not changed since last April. Both cities, however, have already seen their fair share of rate hikes in recent years. From 2007 to 2010, the cost of water doubled in Fresno, while prices increased by half in Chicago.
Residents should get used to water rate increases, says rate consultant Scott Rubin, who doesn’t see an end to rising prices. Rubin has more than 20 years of experience working with water rate design and has written studies for the National Regulatory Research Institute.
“Every trend I look at tells me that it’s likely water costs will increase more than the rate of inflation,” Rubin told Circle of Blue.
Reasons for Increase
Prices are increasing because operational inputs such as chemicals, energy, labor, and water itself are getting more expensive. That is the case in Phoenix, where over the last decade chemical costs per million gallons of treated water have increased by 493 percent, electricity costs by 68 percent, and raw-water costs by 41 percent.
The size of the increase in each of these input categories depends on local factors, such as source-water quality and electricity prices. If water quality is poor, more treatment (and thus more chemicals and energy) will be necessary; if a utility has to pump water from greater depths as aquifers decline or to greater heights, as is the case in the 915-meter (3,000-foot) lift for the Central Arizona Project, energy costs will be greater.
Cities that buy water from regional wholesale suppliers are also paying a premium. San Diego, which imports 90 percent of its water, is one example. The city is paying 66 percent more for untreated water than it did in 2006, largely because prolonged drought has reduced deliveries of cheap water from the Colorado River. This means that cities are leasing water from farmers at greater expense.
Additionally, Circle of Blue reported in October on potential pollution-control regulations for coal-fired power plants that could, within the next few years, raise energy prices and water prices in Arizona, Nevada, and southern California. More stringent water quality regulations—such as tighter controls on arsenic in drinking water—also come with added costs. The arsenic rule, which the Environmental Protection Agency finalized in 2006, forced many utilities to double rates, according to Greenwire.
In addition to higher operating costs, decrepit infrastructure is forcing cities to invest in costly capital-replacement projects. In older cities, Rubin told Circle of Blue, many pipes were laid more than 100 years ago and are reaching the end of their designed life. Furthermore, system expansions that took place during the 1940s and 1950s often used inferior materials because the majority of supplies had been used in fighting World War II.
The result is that, due to corrosion, piped systems are not lasting as long as they were expected to, and many need to be replaced. The cost of not doing so could be frequent water main breaks and flooded homes, streets, and businesses, especially in cities where cold winters are an added stressor. Some cities—like Baltimore, which has had 5,762 water main breaks in the past five years—are already suffering this fate.
The scale of America’s hidden, underground web keeps maintenance workers busy. Houston’s water supply network includes 12,000 kilometers (7,500 miles) of pipes, and the city replaces up to two percent (240 kilomters, 150 miles) of its water lines per year, said public information officer Alvin Wright.
Despite Cuts, No End In Sight?
To keep rate increases minimal, deflect public ire, and meet the standards set by regulatory boards, utilities have been streamlining daily operations, merging departments, and cutting staff.
Phoenix, for instance, cut the operating budget for its water services department by $10 million. The city did so by furloughing employees and eliminating a quarter of management positions. Milwaukee Water Works cut its full-time staff by 17 percent between 2000 and 2009, and the city has stopped replacing non-critical staff members who retire.
Yet, even trimming bureaucratic fat can’t overcome rising input costs and the long-term pressures of maintaining a system that is reliant on so much hardware.
“Efficiency will help systems avoid some variable costs of production in the short run and capacity costs in the long run,” Jan Beecher, director of Michigan State University’s Institute of Public Utilities, wrote in an email to Circle of Blue. “But people will need to get used to higher rates for water that reflect the true cost of service.”
Brett Walton is a Seattle-based reporter for Circle of Blue. Contact Brett Walton
Graphics by Trevor Seela, a former Circle of Blue intern and a Chicago-based undergraduate student at the Medill School of Journalism at Northwestern University.
*Note: The first water price survey, published by Circle of Blue in April 2010, used population figures from the 2000 Census, while the 2011 survey used 2010 Census data. Although Baltimore has dropped out of the 20 largest cities over the last decade, the city remains in the water rate index for consistency.
Circle of Blue gathered water rate information from the website of each city’s water utility or from the utilities themselves. Prices are based on single-family residential rates and are current as of April 1, 2011. Average monthly prices for cities with seasonal rates were calculated using seasonal weighting.
