Parsing the Water Pricing Data
Which cities have the highest rates? And why?
Yesterday, Circle of Blue published the 2012 update to our annual water pricing survey. I want to go into greater detail on a few things that did not make it into the story.
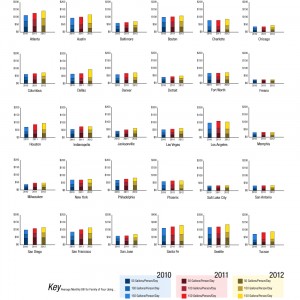
The survey does not measure an average bill. For that, we would take the median residential water use for each city and use that number as the basis for the rate calculations. Instead, what this survey shows is the cost of a constant volume of water across the nation’s major metropolitan areas. If you moved from city to city and kept your consumption patterns the same, this is what you would see in your water bill. (And as Aneesh Prabhu, a Standard and Poor’s credit analyst, reminded me: high rates do not necessarily lead to high bills — consumption is the other part of the equation.)
That said, we can look at a few trends:
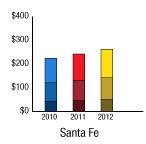
- Since we started the survey in 2010, Santa Fe continues to have the highest prices at each consumption level. The city has extremely expensive rates in the higher of its two blocks — $US 20.07 per 3,785 liters (1,000 gallons). The city’s rate schedule can be found here.
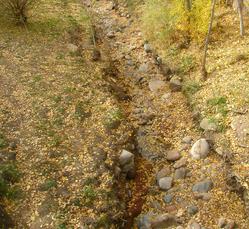
- To encourage conservation. The city is in a dry region and has few reliable water sources. Anecdotally, I can tell you that the rates have a significant effect on landscaping, which is typically the top residential water use. When I was in Santa Fe last November for a reporting fellowship, I remember seeing no homes with a lawn.
- To pay for new infrastructure. The city is constructing a water supply project from the Rio Grande, 25 miles to the northwest. The Buckman Direct Diversion will cost the city $US 187 million. With a small base of ratepayers (around 78,000), such a project has a greater effect on what each customer must pay.
- Santa Fe is not alone among cities that are raising rates to pay for long-distance diversions. Colorado Springs, which is not a part of the Circle of Blue survey, broke ground last year on the $US 1 billion Southern Delivery System, a 100-kilometer (62-mile) pipeline with a treatment plant and three pump stations to lift the water roughly 300 meters (1,000 feet). At first, utility managers said the project would double water bills for Colorado Springs residents between 2010 and 2016, but now they are claiming that the increase may be only 50 percent.
Residents in Santa Fe see high rates for a couple reasons.
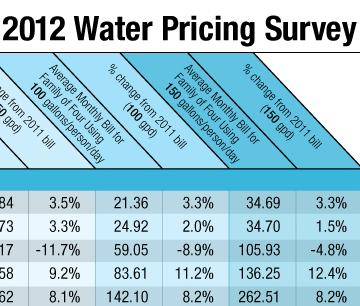
Click on the first image above to enlarge a photo of the dry Santa Fe River beds that I took when I visited the New Mexico capital last November. Reservoirs in the upper reaches of the river are one of the city’s water sources. Click the second image above to enlarge a graphic showing Santa Fe’s water pricing from 2010, 2011, and 2012. Click the third image above to enlarge a table showing how Santa Fe’s water price changes from 2011 to 2012 compare with other U.S. cities that seasonally adjust their water prices. Both graphics made by Circle of Blue design intern, Amanda Northrop.
If anyone knows of a U.S. city with a more expensive residential block rate than Santa Fe’s, please contact Brett Walton
Brett writes about agriculture, energy, infrastructure, and the politics and economics of water in the United States. He also writes the Federal Water Tap, Circle of Blue’s weekly digest of U.S. government water news. He is the winner of two Society of Environmental Journalists reporting awards, one of the top honors in American environmental journalism: first place for explanatory reporting for a series on septic system pollution in the United States(2016) and third place for beat reporting in a small market (2014). He received the Sierra Club’s Distinguished Service Award in 2018. Brett lives in Seattle, where he hikes the mountains and bakes pies. Contact Brett Walton





Leave a Reply
Want to join the discussion?Feel free to contribute!