Infographic: Ogallala Precipitation in Motion — 72 Years Animated GIF (1940 – 2012)
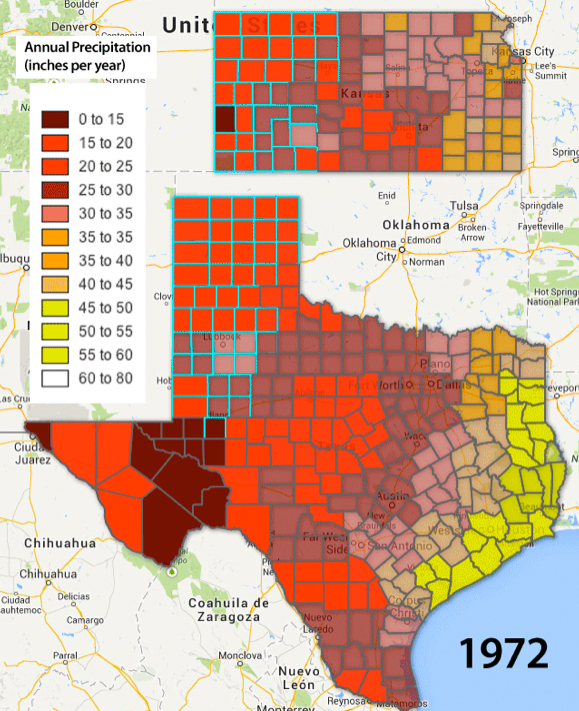
When layered, maps of annual precipitation in Texas and Kansas show the stark moisture division in the United States between the wet East and the dry West running through the Great Plains.
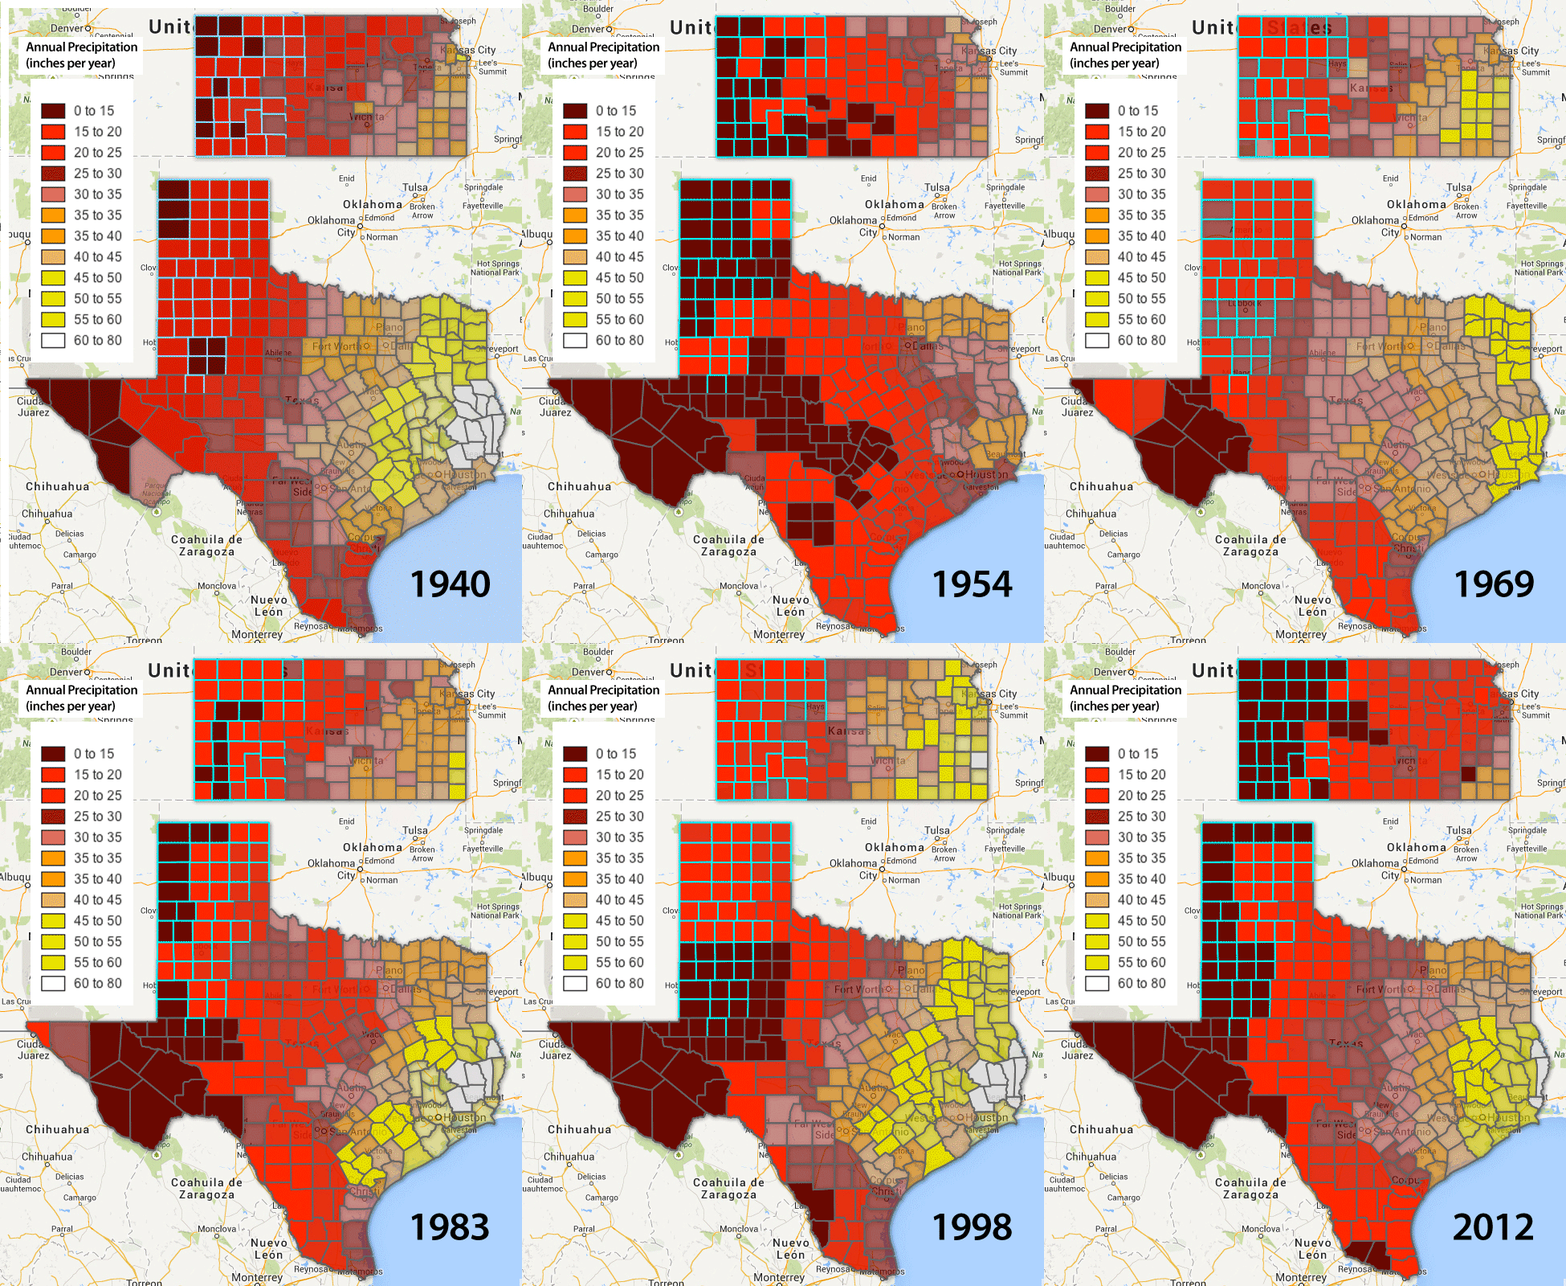
Rainfall is scarce in the High Plains compared to farm regions to the east. Irrigation — using water from the Ogallala Aquifer — is important for raising a bountiful crop. Annual precipitation data by county shows the variability from year to year and region to region. Typically, the western counties of both Texas and Kansas appear in red because they have less than 30 inches of rainfall per year. The Ogallala counties of both states are located in the dry west.
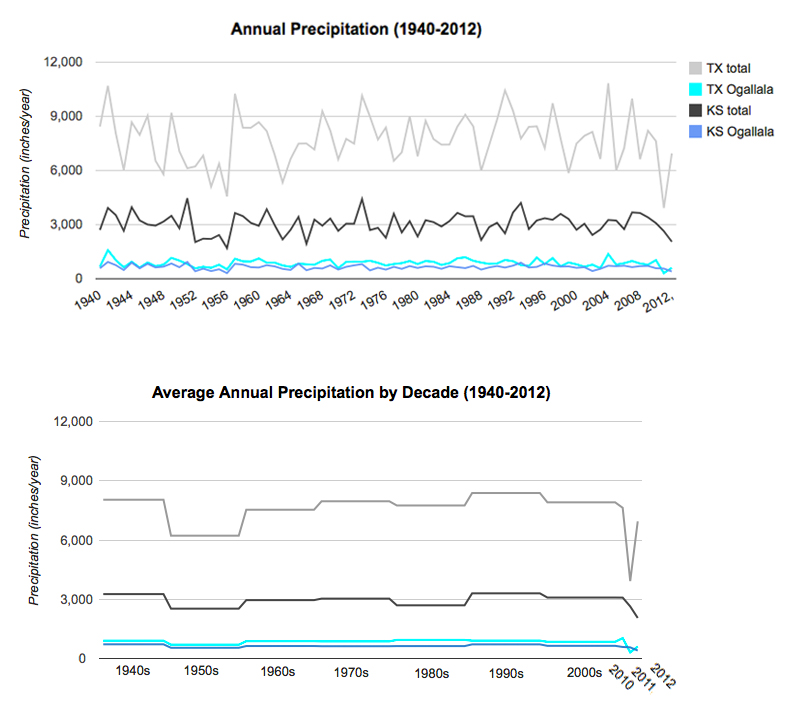
When looking at annual precipitation in Texas and Kansas from 1940 to 2012, it appears like a heart monitor with ups and downs. When spliced with the decade averages, notice that rainfall has remained fairly constant, besides a dry decade in the 1950s.
This GIF map was created by Miles Beauchamp and Aubrey Ann Parker using Google Fusion Tables. Contributors included Brett Walton of Circle of Blue and Sheng Long, a graduate student with the Columbia Water Center in New York City. Columbia interns were overseen by Upmanu Lall and Margo Weiss. County data was pulled from Kansas State University’s weather library. Texas data was pulled from the Texas Water Development Board in one-degree quadrangles which were then fitted to counties.
Choke Point: Index is produced in collaboration with Google Research, Qlikview, and the Columbia Water Center, with financial support from the Rockefeller Foundation.
is a Traverse City-based assistant editor for Circle of Blue. She specializes in data visualization.
Interests: Latin America, Social Media, Science, Health, Indigenous Peoples


Leave a Reply
Want to join the discussion?Feel free to contribute!