Posts
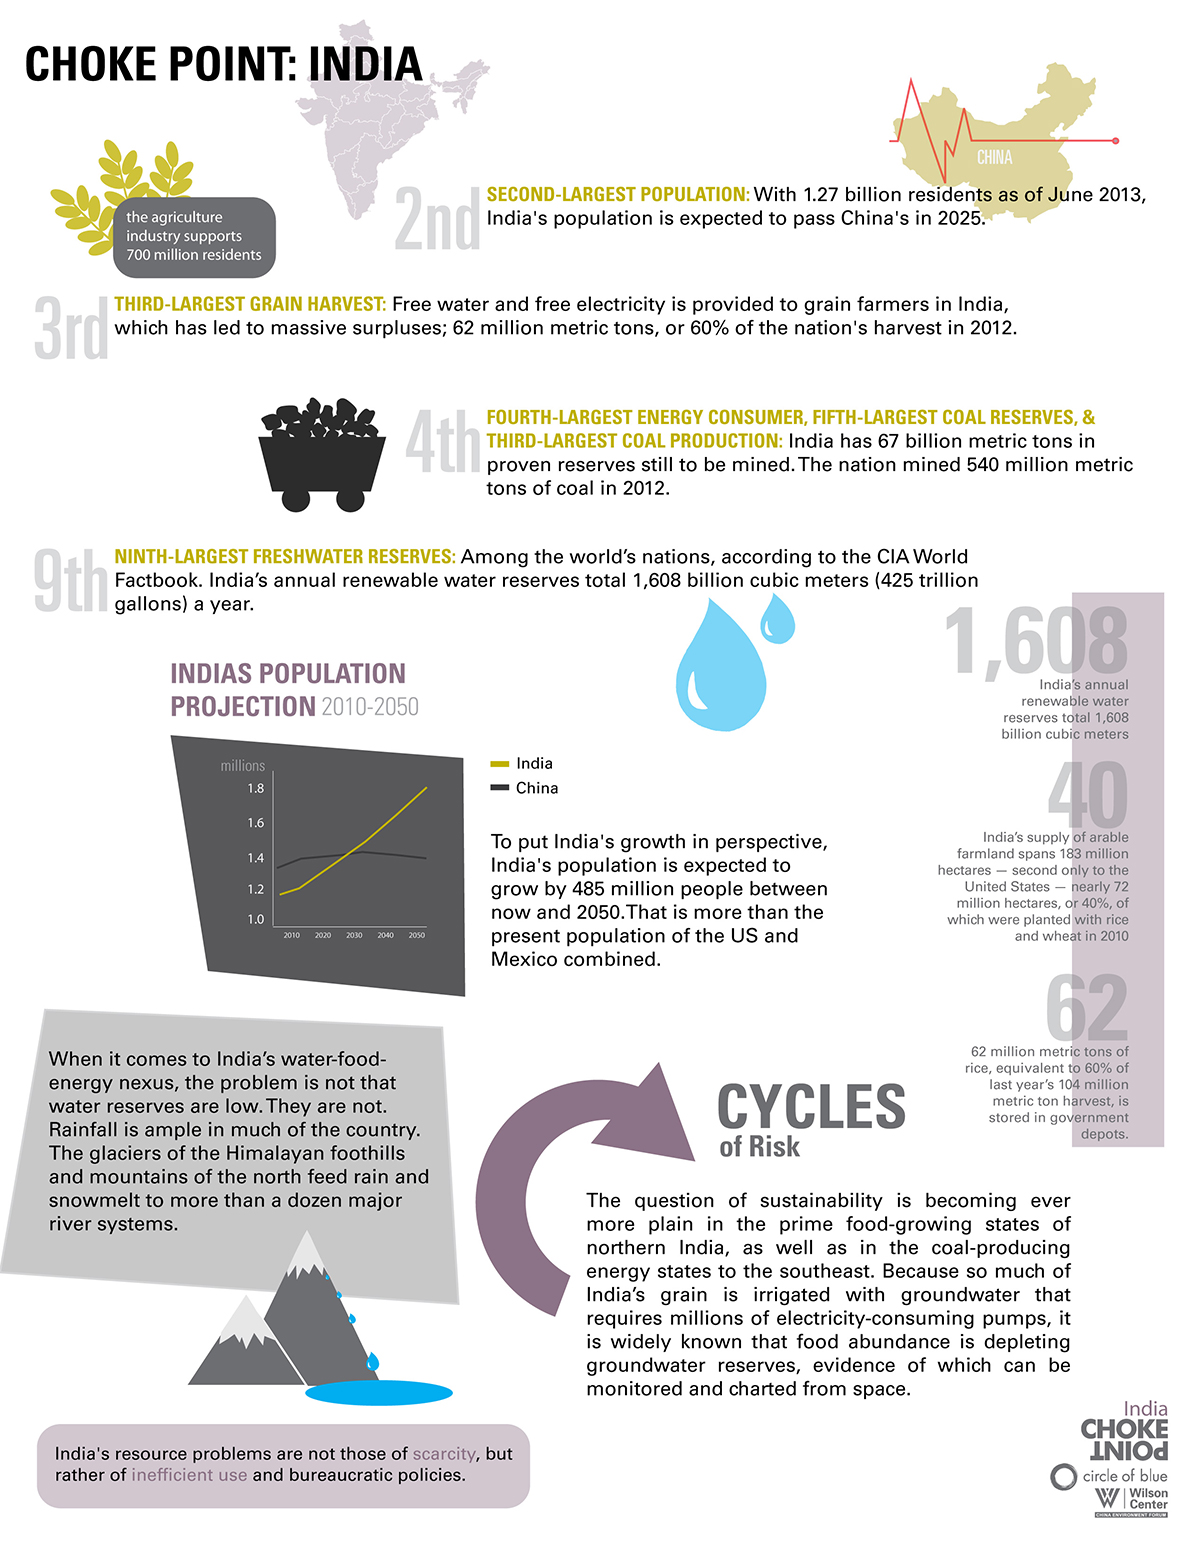
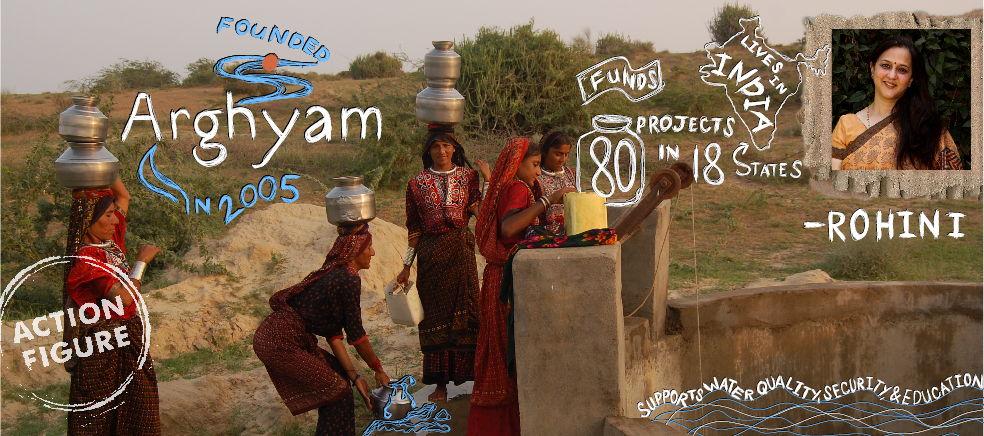
Infographic: Water, Food, and Energy Choke Points in India
1 Comment
/
India's resource problems are not those of scarcity, but rather of inefficient use and bureaucratic policies.
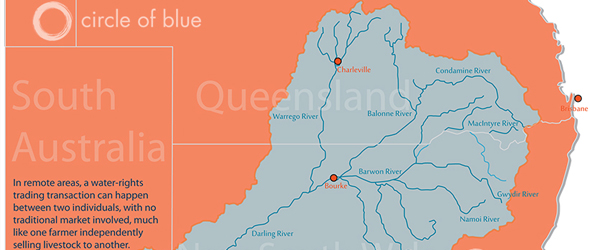
Map: 30 Years of Trading Water in Australia
Learn more about the history of trading water in Australia's three markets in this infographic.
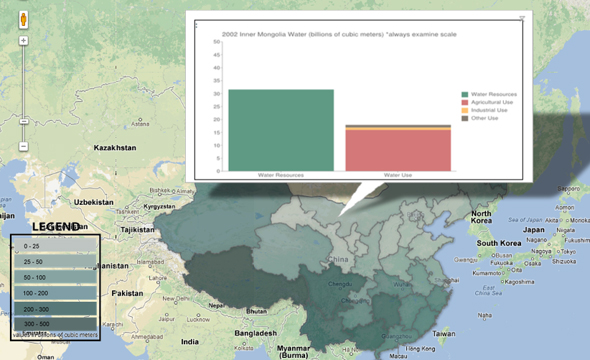
Map: China’s Provincial Water Resources and Use (2002-2010)
Click through the interactive infographic to see how China, the world’s largest nation and second-largest economy, faces multiple challenges for sustaining its water supply.
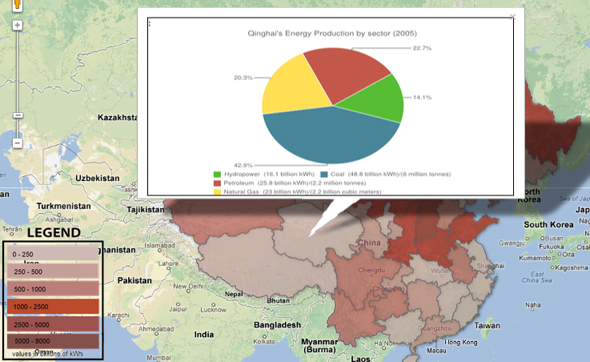
Map: China’s Provincial Energy Production (1997-2010)
Click through the interactive infographic to see how China, the…
 https://www.circleofblue.org/wp-content/uploads/2012/12/Nilekani-graphic-banner-revised-01.jpg
436
984
Lydia Belanger
https://www.circleofblue.org/wp-content/uploads/2018/06/Circle-of-Blue-Water-Speaks-600x139.png
Lydia Belanger2012-12-07 06:00:582012-12-14 11:10:41Rohini Nilekani
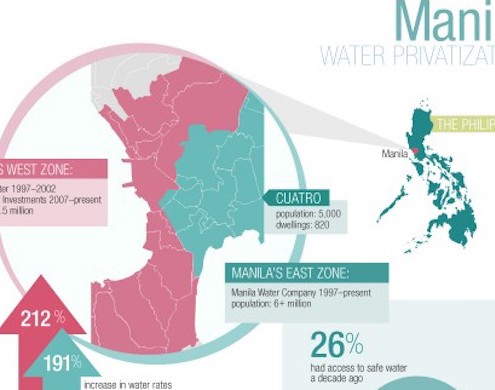
Infographic: Water Privatization in the Philippines
Breaking down the history of water privatization in the Philipine capital of Manila, this infographic explores the city's varied success with privatization using a timeline and a map.
Infographic: Unprescribed — Drugs in the Water Cycle
In 2009, 3.9 billion prescriptions were dispensed in the United States, and an estimated 10 to 40 percent of medicines are not used. With 78 million baby boomers reaching the age when prescription drug use will increase, how will this affect environmental and drinking water?
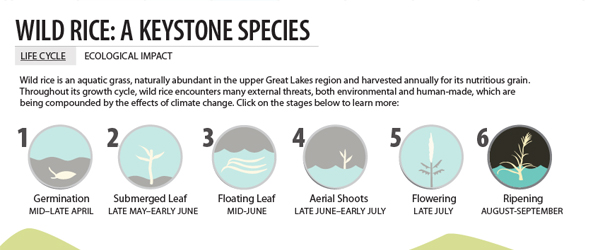
Infographic: Wild Rice is Keystone Species for Upper Great Lakes Region
Wild Rice is an aquatic grass that is harvested annually for…
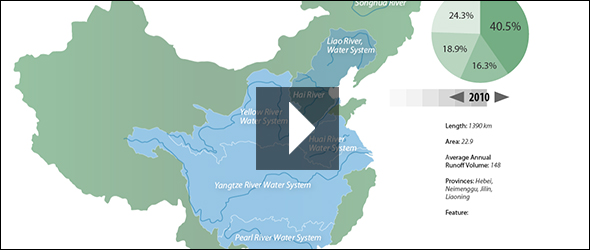
Infographic: Map of Pollution Levels in China’s Major River Basins
The seven major river basins, as a whole, have had steady improvements in water quality over the past decade.
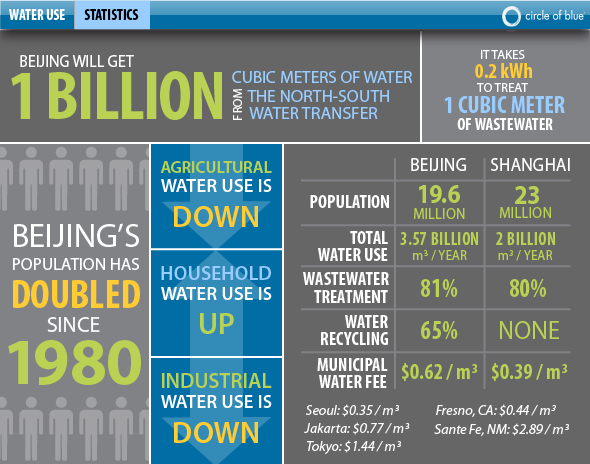
Infographic: Beijing Water Use and Population Statistics
The population of China's capital has doubled since 1980, and, though agricultural and industrial water use is down, municipal use is up.
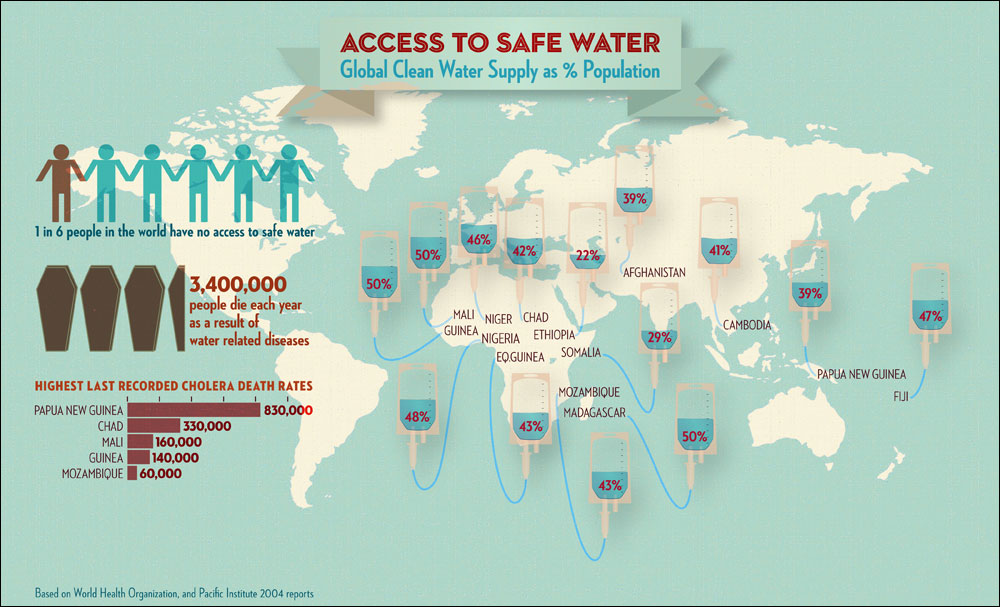
Infographic: Access to Safe Water—Countries Where Less Than 50 Percent Have Access
Global clean water supply by countries those less than 50% of the population can reach, and its facts, based on WHO and Pacific Institute 2004 reports.
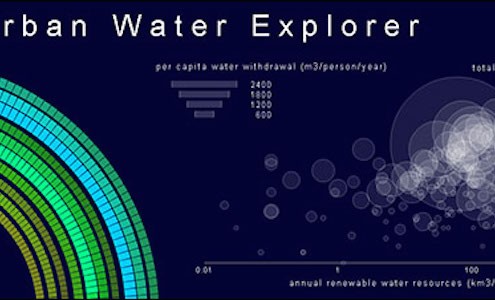
Infographic: Interactive Urban Water Explorer
Entry in the 2011 Urban Water Design Challenge, sponsored by Visualizing.org and Circle of Blue.

