
Posts
 https://www.circleofblue.org/wp-content/uploads/2012/03/067_american-plumbing275.jpg
160
275
Circle of Blue
https://www.circleofblue.org/wp-content/uploads/2018/06/Circle-of-Blue-Water-Speaks-600x139.png
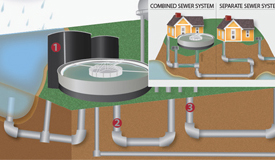
Circle of Blue2012-03-21 16:08:212016-03-10 13:53:47Infographic: American Plumbing — Tapping Into Water Infrastructure
https://www.circleofblue.org/wp-content/uploads/2012/03/067_american-plumbing275.jpg
160
275
Circle of Blue
https://www.circleofblue.org/wp-content/uploads/2018/06/Circle-of-Blue-Water-Speaks-600x139.png
Circle of Blue2012-03-21 16:08:212016-03-10 13:53:47Infographic: American Plumbing — Tapping Into Water Infrastructure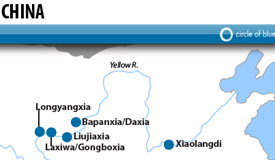 https://www.circleofblue.org/wp-content/uploads/2012/03/066_hydro-in-china275.jpg
160
275
Mark Townsend
https://www.circleofblue.org/wp-content/uploads/2018/06/Circle-of-Blue-Water-Speaks-600x139.png
Mark Townsend2012-03-19 11:50:572015-12-11 11:59:48Map: Major Hydropower in China
https://www.circleofblue.org/wp-content/uploads/2012/03/066_hydro-in-china275.jpg
160
275
Mark Townsend
https://www.circleofblue.org/wp-content/uploads/2018/06/Circle-of-Blue-Water-Speaks-600x139.png
Mark Townsend2012-03-19 11:50:572015-12-11 11:59:48Map: Major Hydropower in China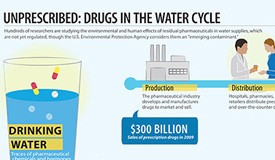 https://www.circleofblue.org/wp-content/uploads/2011/12/065_unprescribed-drugs275.jpg
160
275
Kelly Shea
https://www.circleofblue.org/wp-content/uploads/2018/06/Circle-of-Blue-Water-Speaks-600x139.png
Kelly Shea2011-12-02 15:36:472012-07-02 10:52:45Infographic: Unprescribed — Drugs in the Water Cycle
https://www.circleofblue.org/wp-content/uploads/2011/12/065_unprescribed-drugs275.jpg
160
275
Kelly Shea
https://www.circleofblue.org/wp-content/uploads/2018/06/Circle-of-Blue-Water-Speaks-600x139.png
Kelly Shea2011-12-02 15:36:472012-07-02 10:52:45Infographic: Unprescribed — Drugs in the Water Cycle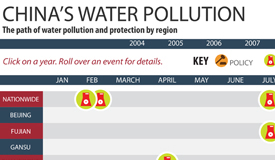 https://www.circleofblue.org/wp-content/uploads/2011/10/064_china-water-poll.275.jpg
160
275
Mark Townsend
https://www.circleofblue.org/wp-content/uploads/2018/06/Circle-of-Blue-Water-Speaks-600x139.png
Mark Townsend2011-10-05 12:19:092015-12-11 12:00:19Infographic: China’s Water Pollution Events and Protection Policies (2004-2011)
https://www.circleofblue.org/wp-content/uploads/2011/10/064_china-water-poll.275.jpg
160
275
Mark Townsend
https://www.circleofblue.org/wp-content/uploads/2018/06/Circle-of-Blue-Water-Speaks-600x139.png
Mark Townsend2011-10-05 12:19:092015-12-11 12:00:19Infographic: China’s Water Pollution Events and Protection Policies (2004-2011)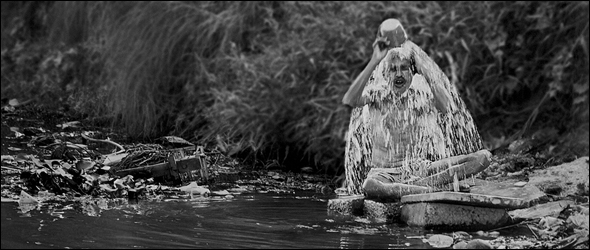 https://www.circleofblue.org/wp-content/uploads/2011/08/prakash-590x250.jpg
250
590
Circle of Blue
https://www.circleofblue.org/wp-content/uploads/2018/06/Circle-of-Blue-Water-Speaks-600x139.png
Circle of Blue2011-08-31 06:55:172016-01-19 13:34:21Photo Slideshow and Q&A: Om Prakash Singh Documents the Perception and Harsh Realities of Water and Sanitation in Delhi, India
https://www.circleofblue.org/wp-content/uploads/2011/08/prakash-590x250.jpg
250
590
Circle of Blue
https://www.circleofblue.org/wp-content/uploads/2018/06/Circle-of-Blue-Water-Speaks-600x139.png
Circle of Blue2011-08-31 06:55:172016-01-19 13:34:21Photo Slideshow and Q&A: Om Prakash Singh Documents the Perception and Harsh Realities of Water and Sanitation in Delhi, India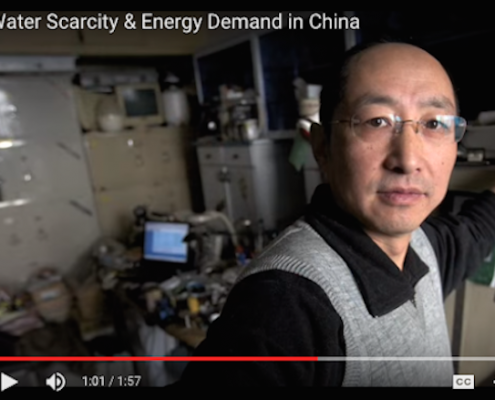 https://www.circleofblue.org/wp-content/uploads/2011/08/Screen-Shot-2016-02-05-at-12.17.29-PM-1.png
439
600
Circle of Blue
https://www.circleofblue.org/wp-content/uploads/2018/06/Circle-of-Blue-Water-Speaks-600x139.png
Circle of Blue2011-08-30 13:58:182021-03-20 12:48:08Video: Confronting Water Scarcity & Energy Demand in China
https://www.circleofblue.org/wp-content/uploads/2011/08/Screen-Shot-2016-02-05-at-12.17.29-PM-1.png
439
600
Circle of Blue
https://www.circleofblue.org/wp-content/uploads/2018/06/Circle-of-Blue-Water-Speaks-600x139.png
Circle of Blue2011-08-30 13:58:182021-03-20 12:48:08Video: Confronting Water Scarcity & Energy Demand in China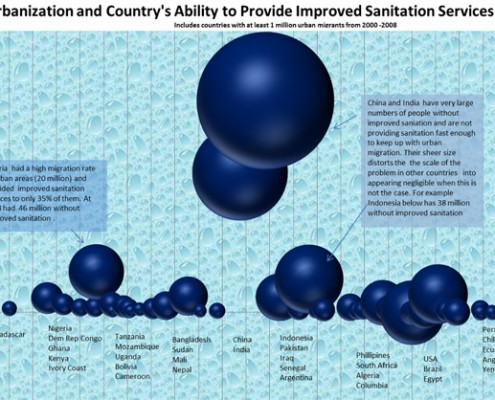 https://www.circleofblue.org/wp-content/uploads/2011/08/visualizing-jonathan-sanita-1.jpg
418
590
Circle of Blue
https://www.circleofblue.org/wp-content/uploads/2018/06/Circle-of-Blue-Water-Speaks-600x139.png
Circle of Blue2011-08-27 08:00:572016-02-12 11:37:07Infographic: WASH and Urbanization — Providing Sanitation and Water Services by Country
https://www.circleofblue.org/wp-content/uploads/2011/08/visualizing-jonathan-sanita-1.jpg
418
590
Circle of Blue
https://www.circleofblue.org/wp-content/uploads/2018/06/Circle-of-Blue-Water-Speaks-600x139.png
Circle of Blue2011-08-27 08:00:572016-02-12 11:37:07Infographic: WASH and Urbanization — Providing Sanitation and Water Services by Country https://www.circleofblue.org/wp-content/uploads/2011/08/chalres-fishman-290.jpg
363
290
Circle of Blue
https://www.circleofblue.org/wp-content/uploads/2018/06/Circle-of-Blue-Water-Speaks-600x139.png
Circle of Blue2011-08-19 12:52:512011-08-31 10:05:15Q & A: Charles Fishman on The Big Thirst
https://www.circleofblue.org/wp-content/uploads/2011/08/chalres-fishman-290.jpg
363
290
Circle of Blue
https://www.circleofblue.org/wp-content/uploads/2018/06/Circle-of-Blue-Water-Speaks-600x139.png
Circle of Blue2011-08-19 12:52:512011-08-31 10:05:15Q & A: Charles Fishman on The Big Thirst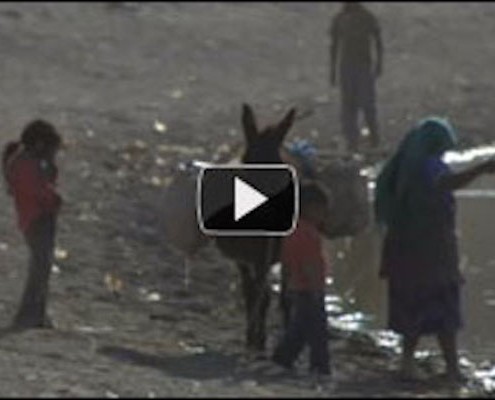 https://www.circleofblue.org/wp-content/uploads/2011/08/th_tehuacan1-2.jpg
400
700
Circle of Blue
https://www.circleofblue.org/wp-content/uploads/2018/06/Circle-of-Blue-Water-Speaks-600x139.png
Circle of Blue2011-08-15 13:19:242016-02-12 11:38:08Tehuacán Video Essay: Scarcity and Solutions – Pt. 1
https://www.circleofblue.org/wp-content/uploads/2011/08/th_tehuacan1-2.jpg
400
700
Circle of Blue
https://www.circleofblue.org/wp-content/uploads/2018/06/Circle-of-Blue-Water-Speaks-600x139.png
Circle of Blue2011-08-15 13:19:242016-02-12 11:38:08Tehuacán Video Essay: Scarcity and Solutions – Pt. 1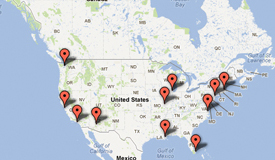 https://www.circleofblue.org/wp-content/uploads/2011/08/062_U.S.-map2751.jpg
160
275
Brett Walton
https://www.circleofblue.org/wp-content/uploads/2018/06/Circle-of-Blue-Water-Speaks-600x139.png
Brett Walton2011-08-09 06:00:392012-07-02 11:19:24Interactive Map: U.S. Cities Acting Now to Reduce Water Risk from Climate Change
https://www.circleofblue.org/wp-content/uploads/2011/08/062_U.S.-map2751.jpg
160
275
Brett Walton
https://www.circleofblue.org/wp-content/uploads/2018/06/Circle-of-Blue-Water-Speaks-600x139.png
Brett Walton2011-08-09 06:00:392012-07-02 11:19:24Interactive Map: U.S. Cities Acting Now to Reduce Water Risk from Climate Change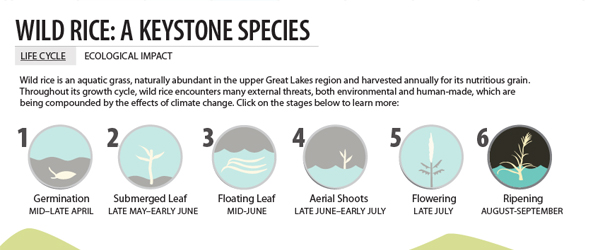 https://www.circleofblue.org/wp-content/uploads/2011/08/wild-rice-infographic.jpg
250
590
Kelly Shea
https://www.circleofblue.org/wp-content/uploads/2018/06/Circle-of-Blue-Water-Speaks-600x139.png
Kelly Shea2011-08-05 13:35:542021-02-15 19:52:17Infographic: Wild Rice is Keystone Species for Upper Great Lakes Region
https://www.circleofblue.org/wp-content/uploads/2011/08/wild-rice-infographic.jpg
250
590
Kelly Shea
https://www.circleofblue.org/wp-content/uploads/2018/06/Circle-of-Blue-Water-Speaks-600x139.png
Kelly Shea2011-08-05 13:35:542021-02-15 19:52:17Infographic: Wild Rice is Keystone Species for Upper Great Lakes Region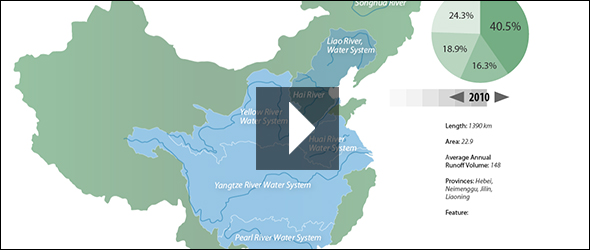 https://www.circleofblue.org/wp-content/uploads/2011/07/pollution-590x250.jpg
250
590
Mark Townsend
https://www.circleofblue.org/wp-content/uploads/2018/06/Circle-of-Blue-Water-Speaks-600x139.png
Mark Townsend2011-07-19 06:00:322016-02-18 15:00:18Infographic: Map of Pollution Levels in China’s Major River Basins
https://www.circleofblue.org/wp-content/uploads/2011/07/pollution-590x250.jpg
250
590
Mark Townsend
https://www.circleofblue.org/wp-content/uploads/2018/06/Circle-of-Blue-Water-Speaks-600x139.png
Mark Townsend2011-07-19 06:00:322016-02-18 15:00:18Infographic: Map of Pollution Levels in China’s Major River Basins