Posts
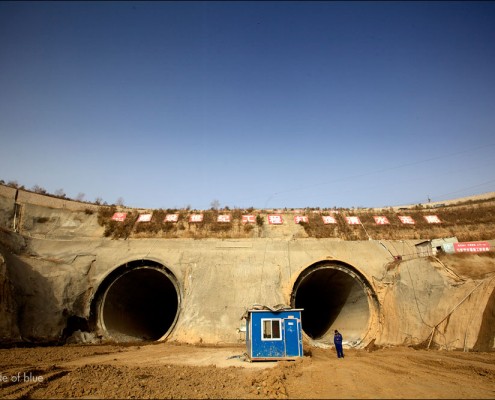
Photo Slideshow: China Completes Second Line of South-North Water Transfer Project
Massive manmade river begins moving water from central China to Beijing.
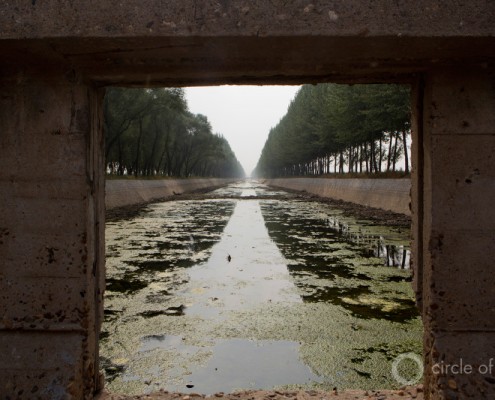
Photo Slideshow: China’s Polluted Waters
0 Comments
/
Pollution is a major driver of water scarcity in China, especially in the places where economic growth is the highest and water resources are under the most stress — China’s dry northern breadbaskets and its biggest manufacturing hubs in the south and east.
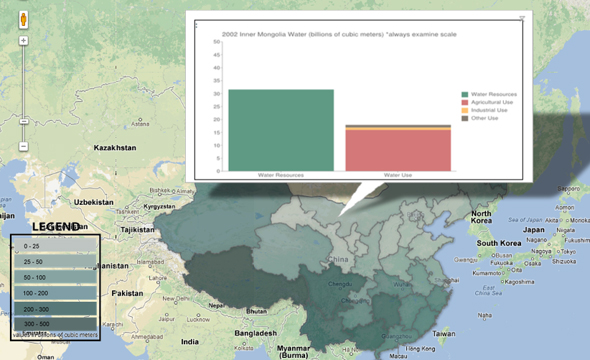
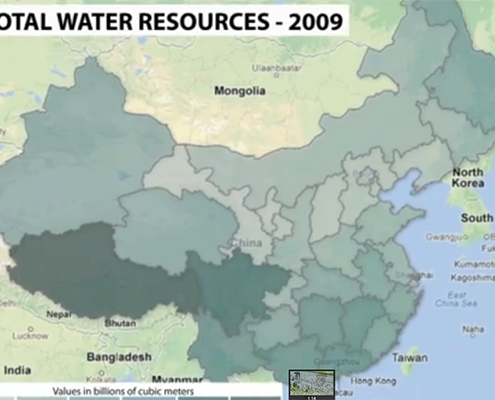
Map: China’s Provincial Water Resources and Use (2002-2010)
Click through the interactive infographic to see how China, the world’s largest nation and second-largest economy, faces multiple challenges for sustaining its water supply.
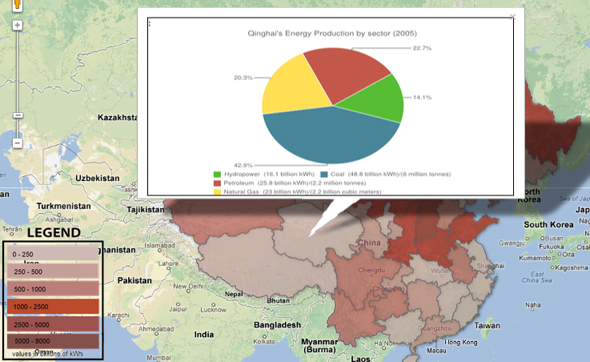
Map: China’s Provincial Energy Production (1997-2010)
Click through the interactive infographic to see how China, the…
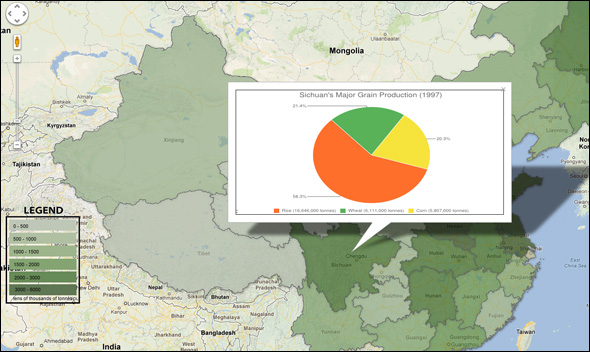
Map: China’s Provincial Grain Production (1997-2010)
Click through the interactive infographic to see how China, the world’s largest nation and second-largest economy, has shifted its bread baskets to the north.
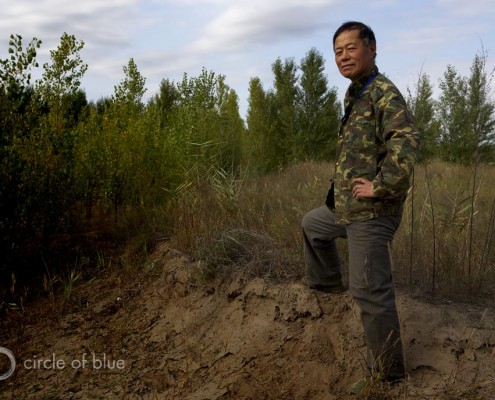
Photo Slideshow: Irrigating Northeastern China’s Breadbasket
By J. Carl Ganter and Keith Schneider
The northeast region…
 https://www.circleofblue.org/wp-content/uploads/2012/11/video-thumb-1.png
400
590
Allison Voglesong
https://www.circleofblue.org/wp-content/uploads/2018/06/Circle-of-Blue-Water-Speaks-600x139.png
Allison Voglesong2012-11-27 11:13:422021-03-22 17:06:00Video: Scarcity, Pollution, and Energy are Choke Point: China II Focus
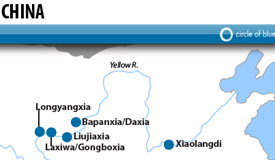
Map: Major Hydropower in China
China is pushing its renewable energy agenda by investing in hydropower. By 2015, the Chinese government expects that its installed capacity from hydropower will amount to 300,000 megawatts, thus reducing the nation's reliance on fossil fuels.
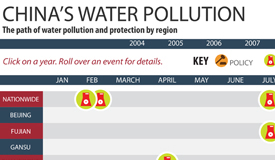
Infographic: China’s Water Pollution Events and Protection Policies (2004-2011)
China has some of the dirtiest and most dangerous water in the world. This detailed and interactive timeline shows key pollution events, protests, and policy reforms from the last eight years at both the national and regional levels as China tries to clean up its act.
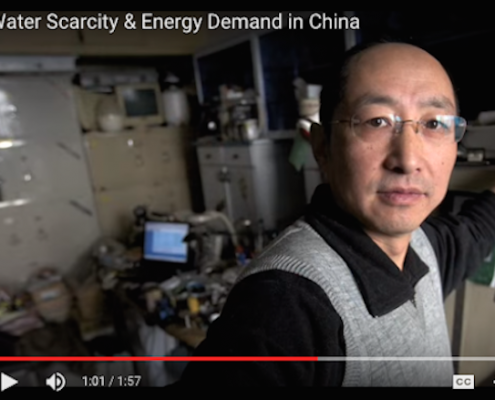
Video: Confronting Water Scarcity & Energy Demand in China
Choke Point: China is an on-the-ground report that displays in text, photographs, and interactive graphics the powerful evidence of a potentially ruinous confrontation between growth, water, and fuel that is already visible across China; a confrontation that is virtually certain to grow more dire over the next decade.
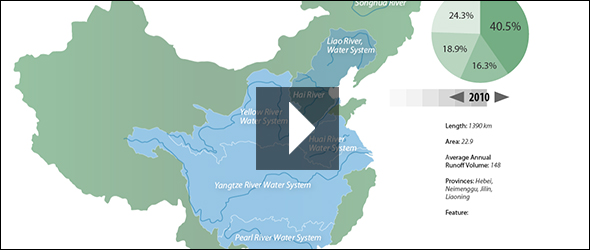
Infographic: Map of Pollution Levels in China’s Major River Basins
The seven major river basins, as a whole, have had steady improvements in water quality over the past decade.
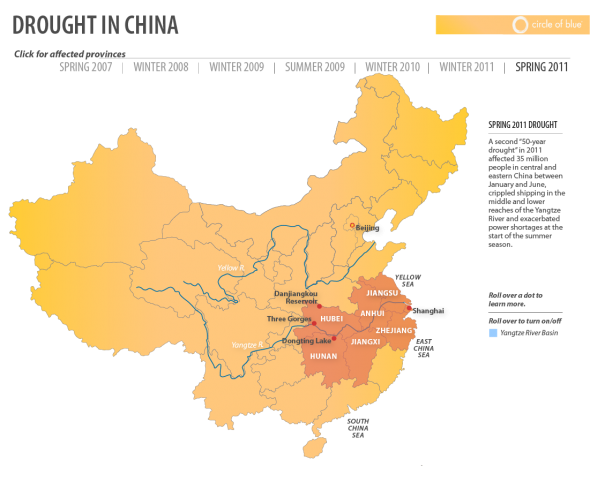
Infographic: Interactive Timeline Mapping China’s Drought-ridden Provinces Since 2007
Water scarcity is becoming an increasingly persistent problem…

