The Birth of a Drought Report: Behind the Scenes with the People Who Produce the U.S. Drought Monitor
Drought blankets much of the United States. Each week, hundreds of scientists interpret how bad it really is.
By Brett Walton
Circle of Blue
On Tuesday, U.S. Agriculture Secretary Tom Vilsack declared all of Missouri’s 114 counties primary disaster areas. Roughly one-third of all U.S. counties now have a federal disaster declaration because of drought. In Nebraska, state officials are telling certain farmers to stop irrigating so that the state can meet water-delivery obligations to Kansas, where some rivers are flowing at less than 1 percent of normal. In Colorado, farmers have asked the governor to allow emergency pumping from restricted aquifers.
A record-setting drought grips the United States, and the foremost tool for measuring its severity is the U.S. Drought Monitor, a weekly national assessment of moisture levels written by 10 federal and academic scientists. Led by the National Drought Mitigation Center, the Monitor is a collaboration that includes the U.S. Department of Agriculture, the National Oceanic and Atmospheric Administration (NOAA), and experts around the country. The Monitor’s slowly shifting galaxy of red and orange warning splashes is regularly cited on the Weather Channel and in Corn Belt newspapers. Federal agencies use it to make disaster determinations.
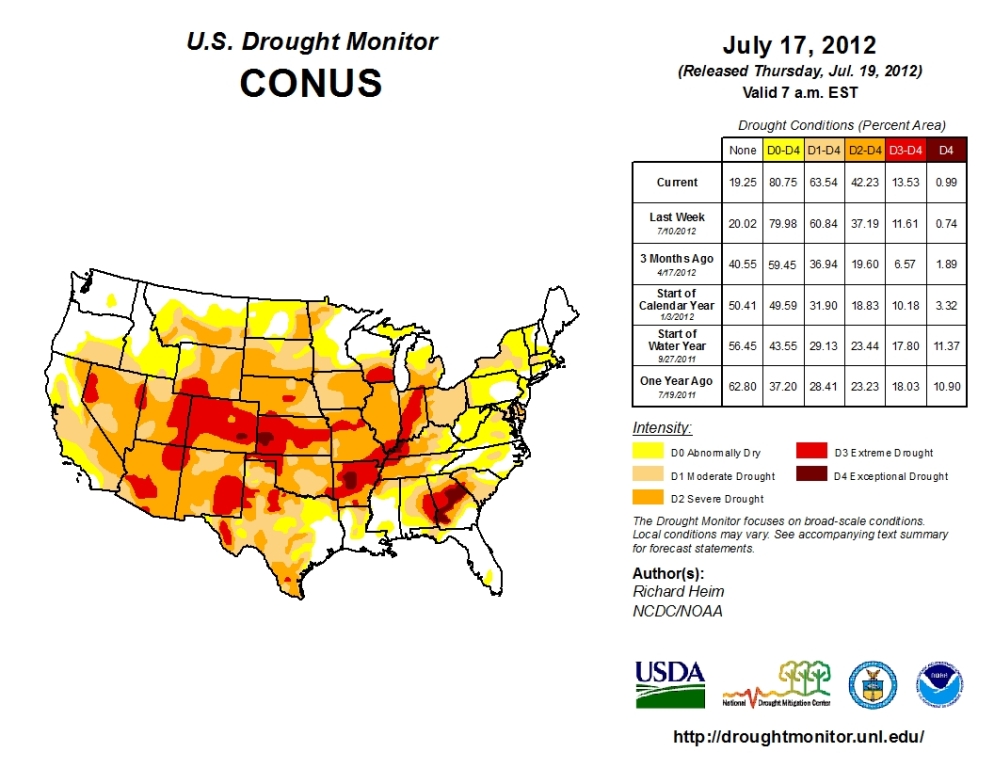
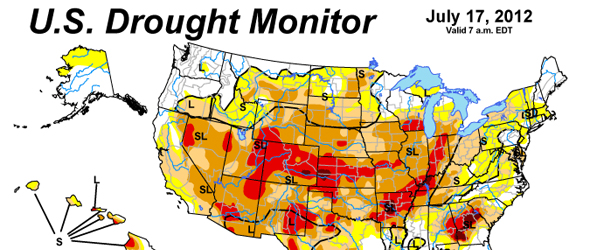
The latest Drought Monitor, released on July 19, revealed that drought has been declared for 63 percent of the contiguous U.S., a larger area of the country affected by pervasively dry weather than any time since 1956. All of this means that Mark Svoboda — a climatologist at the National Drought Mitigation Center in Lincoln, Nebraska, and one of the writers of the Drought Monitor — is a busy man.
“This is my fifteenth interview today,” he told Circle of Blue near the end of office hours on a mid-July afternoon.
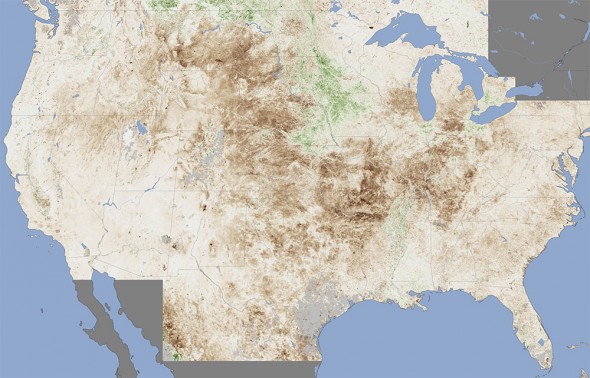
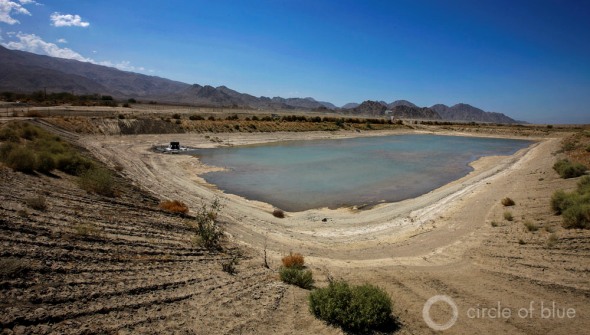
No wonder. The first half of 2012 was the hottest January to June ever in the contiguous U.S. More than 40,000 daily heat records were broken during the six months. Worse, the hot dry summer follows a winter that scarcely showed itself. In many Western river basins, snowpack — the lifeblood of rivers and essential for irrigation — was a fraction of the historical average.
Not even the stereotypically wet Southeast has been spared. Central Georgia is mired in its second historic drought in the last five years, and the Flint River, vital for the state’s agricultural corridor, is seeing its lowest July flows ever.
The consequences are starting to pile up. The USDA recently cut its estimate for corn production by 12 percent — this after a record harvest was forecast earlier in the year from the largest corn crop planted since 1937. But with pastures gone dormant and hay production down, too, ranchers are debating whether to cull their herds.
These outcomes are no surprise to regular viewers of the Drought Monitor. The map itself looks simple, but probe a little deeper into how the Drought Monitor is compiled — into the weekly push and pull between the hundreds of hydrologists, climatologists, and agronomists who offer recommendations to the writers — and one finds the startling complexity that comes from trying to define months of reluctant precipitation.
Developing the Report
“No one person could do this job,” Svoboda said with a laugh. “I’d give them a month on it before they’d lose their sanity.”
Writing the Monitor, which publishes every Thursday, is demanding extracurricular work, requiring its authors to consider oodles of data, attend conference calls, and be the arbiter of classification disputes. That is why scientists from the three collaborating agencies take a two-week rotation at the helm.
When he is in charge, Svoboda looks at 50 to 75 data sets — data on streamflow, reservoir levels, soil moisture, precipitation, and vegetation — before submitting a first draft on Monday. The draft is circulated through a protected email list-serve comprising more than 350 experts from around the country.
List members are “our eyes and ears on the ground,” Svoboda said, and they will bandy recommendations and offer first-hand observations.
“The local people bring a lot more to the table than me trying to cover 50 states in two days,” said Svoboda, who will post revisions on Tuesday and Wednesday mornings, each iteration going through another round of criticism.
When the Drought Monitor began in 1999, it was rather rudimentary, an experimental product that was suddenly and unexpectedly expedited. You see, a drought that summer hung over the nation’s capital, said Svoboda, and policymakers, seeing the effects themselves, wanted better information quickly.
“At first, we were thinking this would be a quarterly or monthly thing,” said Svoboda, who has been on the writing team since the beginning. “But then the drought hit the Northeast and Washington, D.C., and NOAA administrators said ‘You’ll do this weekly, starting in six weeks.’”
Ranking and Classification
Despite the high-level push, the Drought Monitor was designed for the general public. Hurricanes and tornadoes had an easy-to-understand numeric rating, so something similar was sought for drought. The Drought Monitor uses a scale ranging from 0 (abnormally dry) to 4 (exceptional drought). Only categories 1 to 4 are considered “drought.” Alphabetic labels are used to differentiate between short-term effects and longer-term changes to ecosystems.
And with improved technology, maps showing drought ratings at the county level are now possible.
Understanding the scale is essential to understanding the Drought Monitor. The categories are based on the question ‘How rare is this event?’ Moderate drought, a D1, means that conditions happen on average once every five to 10 years. At the top end, a D4 ranges from a once-in-50-years event to a record-setting drought.
The designations refer to local conditions. So, a D2 in Georgia and a D2 in Arizona do not mean that the hydrology is similar; rather, it means that the current conditions in each state are occurring there with the same historical frequency.
Because the Monitor pulls in data from multiple indices, in addition to gleaning in-person observations, assigning a drought classification is never as simple as just looking at the numbers. The National Drought Mitigation Center says that the Monitor is a blend of art and science — that was certainly on display during one of the regional climate discussions that Circle of Blue sat in on earlier this week.
Is it a D3 or a D4?
On Tuesday morning, 26 people dialed into the weekly drought assessment conference call for the Upper Colorado River Basin (which ended up covering the entire state of Colorado). The author of this week’s Drought Monitor, Richard Heim of the National Climatic Data Center, was on the line and the half-hour discussion would inform his report.
After various experts presented recent data on precipitation, streamflow, soil moisture, evapotranspiration, and reservoir levels, the debate centered on two points: whether to expand an area of D4 in southeastern Colorado and whether to downgrade a D4 zone in the Yampa River Basin.
“We’ve had several ranches near Pueblo that liquidated their herds in the last week,” said Chuck Hanagan, describing what he saw in Otero and Crowley counties. Hanagan works for the USDA’s Farm Service Agency in southeastern Colorado.
“Our grass is dormant,” Hanagan said later in the day during an interview with Circle of Blue. “It is not growing. We got a couple inches of rain last week, but you can’t even tell. The cattle should be grazing right now, but ranchers are already using hay.”
Hanagan said the value of the Drought Monitor comes from these interactions that allow the instrumental data to be validated and augmented by people working in the field. It gives the scientific observation a “ground-truth,” as he put it.
Rich Tinker, a drought expert at NOAA’s Climate Prediction Center and a Drought Monitor author, agrees. “The advantage of the process is that we can look at what impacts are occurring and change our prognosis,” he told Circle of Blue. “It’s not completely objective.”
That personal confirmation turns out to be especially important in the Yampa River Basin — the area has few monitoring stations, compared to other areas of Colorado, making it “data sparse.”
When the discussion moved to the Yampa, a National Weather Service meteorologist based in Pueblo, Colorado, said that he would like to see the D4 dropped down to a D3. Some rain had fallen recently, and he did not believe D4 was warranted. Other observers, however, said the situation was so tenuous that if more rain did not come in the next week, circumstances would flip again.
In the end, the group recommended the status quo, though this week’s Drought Monitor author had the final say. “We’ll leave it up to Richard Heim,” said the call moderator, “But we’re leaning toward waiting a week and seeing if those rains come.” For southeastern Colorado, the group recommended a slight expansion of the D4 area.
Weighing The Scales
These kinds of debates may seem trivial, like baseball scorekeepers arguing a hit versus an error, but the designations do matter — for drought scientists and regular Joes, alike.
Just last week the USDA revised its disaster declaration process. Any U.S. county in a D2 drought for more than eight consecutive weeks is declared a primary disaster area, which makes farmers eligible for low-interest loans. As soon as a county gets a D3 drought label, it is immediately declared a disaster area. The department also makes it easier for areas in D2 or D3 to get a waiver for developing farmland placed in a conservation reserve.
“There’s a lot of respect within the USDA for the Drought Monitor,” Hanagan said.
But the designations — though they capture as much information as possible — fall short in some ways. Drought, as the people interviewed for this story repeatedly said, is measured best by its impacts. To this end, in July 2005, the National Drought Mitigation Center launched the Drought Impact Reporter, a catalogue of news stories about environmental and socio-economic effects, to accompany the Drought Monitor.
Yet, when the demands on a hydrologic system increase — when cities grow, when farming becomes more intensive and when water withdrawals increase— the consequences of heat and cloudless summer months are magnified.
“Vulnerability is not captured in the Drought Monitor,” Svoboda explained. “And it’s an important angle. The effects historically associated with a D3 or D4 might now be felt in a hydrological D1 or D2.”
In other words, a moderate dry period may now produce more serious effects than it would have in the past. A city of 100,000, for instance, is much more vulnerable than a city of 40,000, if water-use behaviors remain the same. It is an unsettling conclusion, especially as scientists discover historical droughts more pernicious than the present-day and as climate change threatens part of the U.S. with an even warmer, drier future.
Those investigations, however, will not come from Svoboda’s group, which has no dedicated source of funding for the Drought Monitor.
“We’re doing just enough to keep our heads above water,” he said. “Hopefully we’ve planted the seed for other research groups, that this is something they should take a look at.”
Brett writes about agriculture, energy, infrastructure, and the politics and economics of water in the United States. He also writes the Federal Water Tap, Circle of Blue’s weekly digest of U.S. government water news. He is the winner of two Society of Environmental Journalists reporting awards, one of the top honors in American environmental journalism: first place for explanatory reporting for a series on septic system pollution in the United States(2016) and third place for beat reporting in a small market (2014). He received the Sierra Club’s Distinguished Service Award in 2018. Brett lives in Seattle, where he hikes the mountains and bakes pies. Contact Brett Walton




Thank you for putting together this piece. As someone who watches the weekly Drought Monitor unfold firsthand, it is a daunting task, and these authors do an amazing job. As a side note, I was the “call moderator” for the Upper Colorado River Basin and that was definitely a stressful call for me. It’s hard to know what to do when people have very strong feelings on both sides of the table!
Finally, you said that it was a National Weather Service meteorologist from Pueblo who argued about the D4 in the Yampa in northwest CO. It was actually the NWS office in Grand Junction. Thanks.