Infographic: Wastewater Treatment Costs in Major U.S. Cities
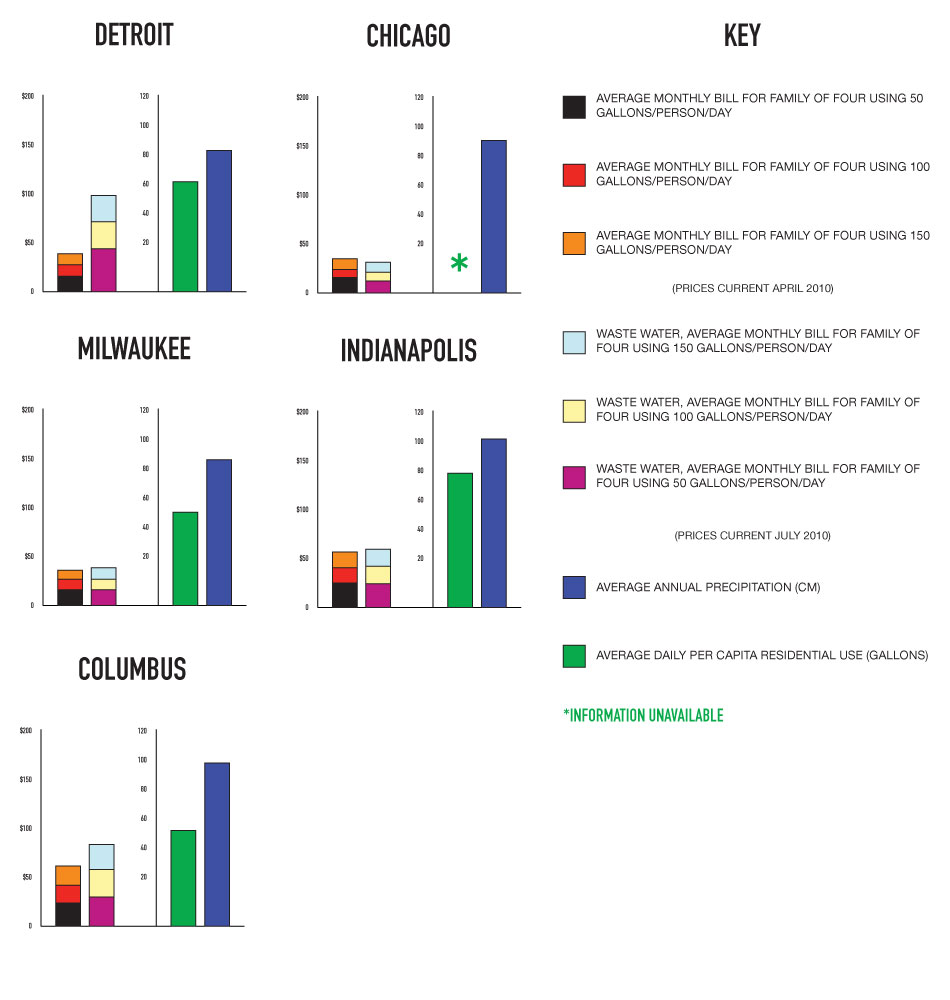
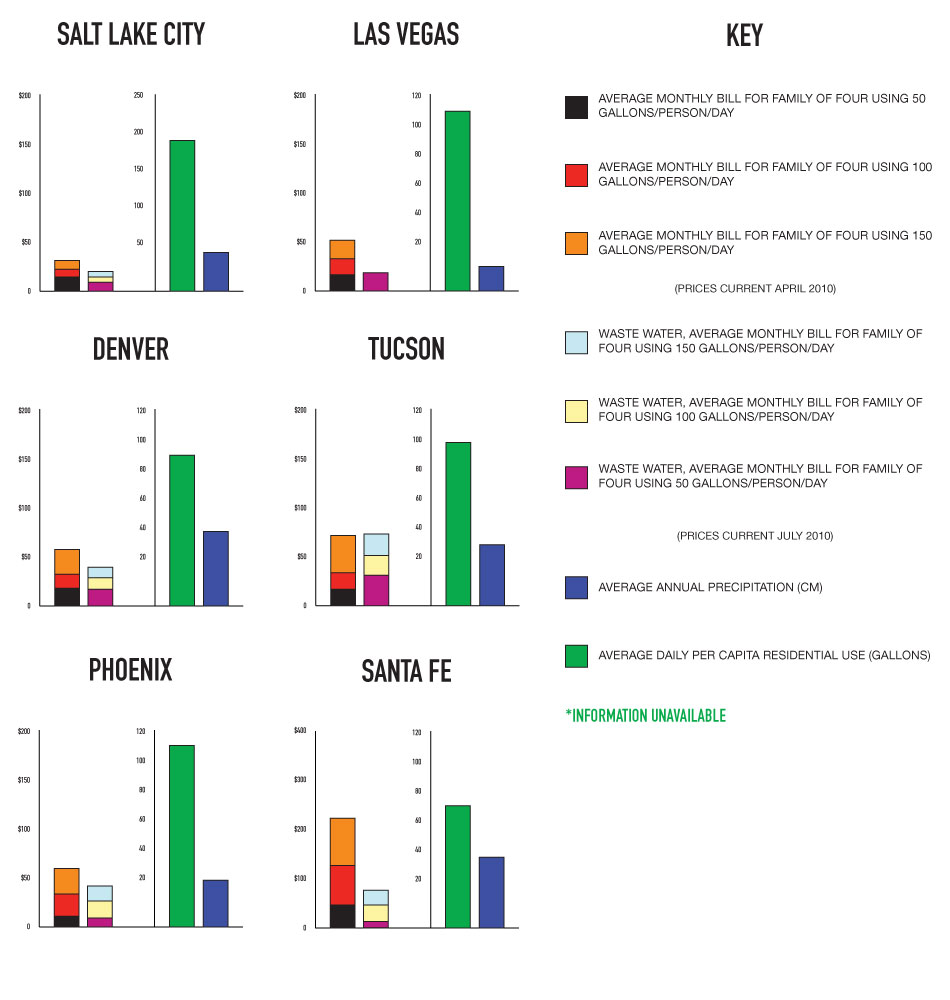
Following Circle of Blue’s survey of water prices, we examine the wastewater costs of the same 30 major cities.
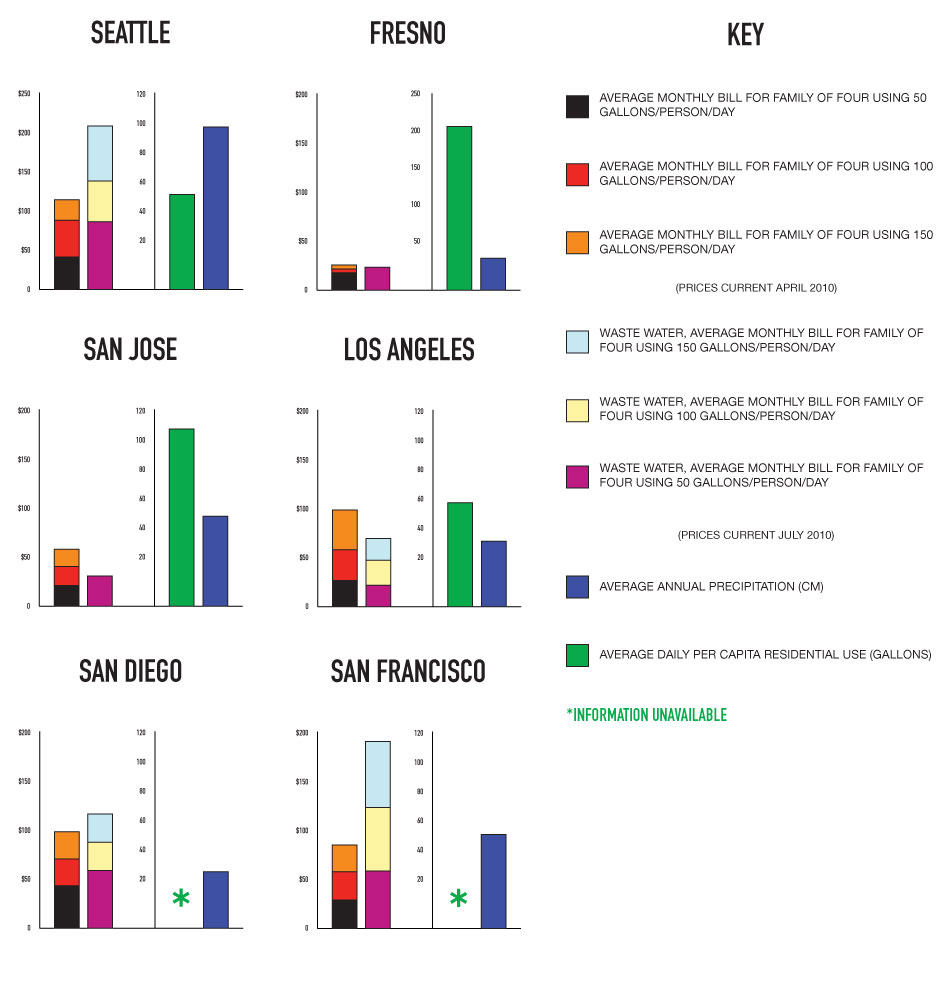
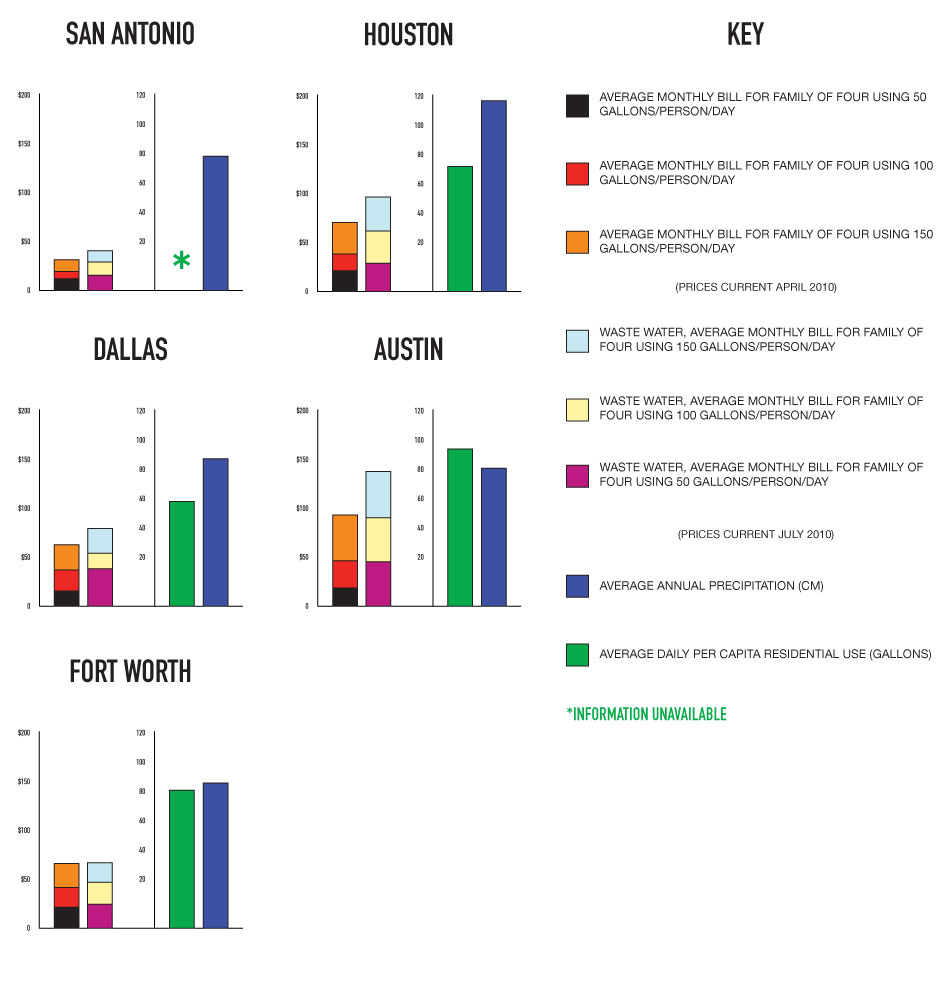
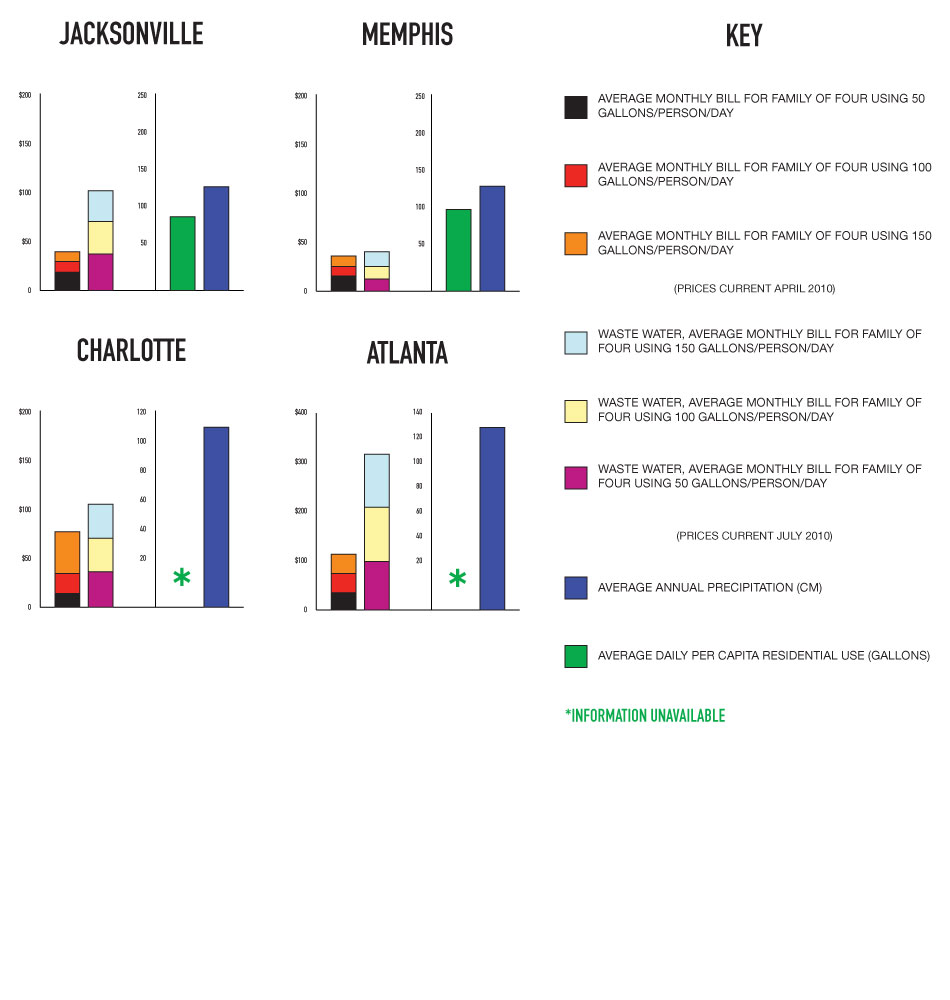
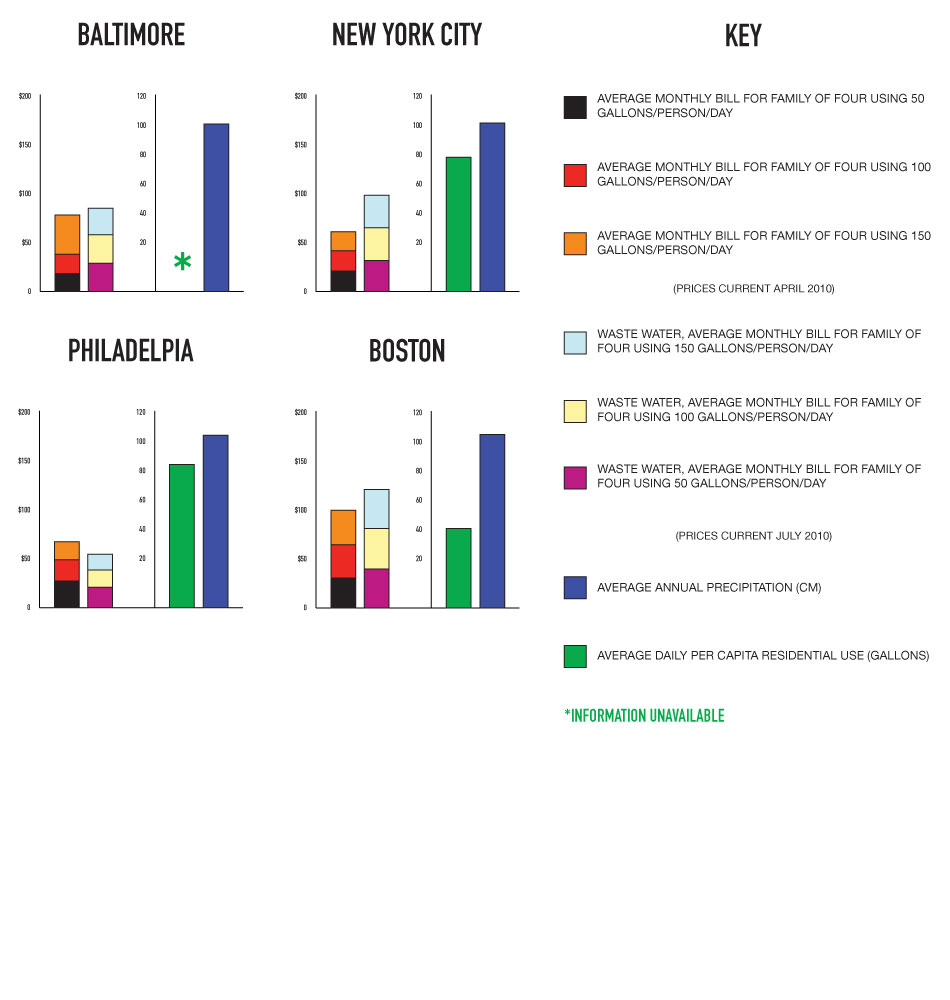
In April Circle of Blue released a survey of water pricing systems in 30 major U.S. cities. We return to that list to examine the wastewater costs of those same urban centers. While treatment plants are costly, more cities are dealing with the problem of combined sewer overflows—disentangling storm water drains from the sewer system.
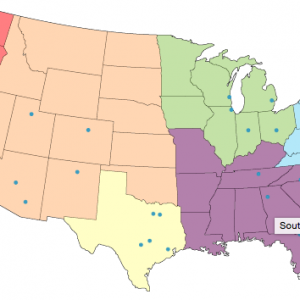
Developing new infrastructure is leading to increased up-front costs for wastewater treatment—cities in the midst of capital improvements such as Atlanta and Seattle have the highest rates in the survey. And if other plants are forced to overhaul their systems, customers could see significantly larger numbers on their sewer bills. We cannot ignore the arriving wave of rehabilitation and replacement we will face over the next several decades. To do so would put the achievements of the last 30-40 years and our nation’s waters and public health at risk. Click the map below for regional overviews of cities surveyed.
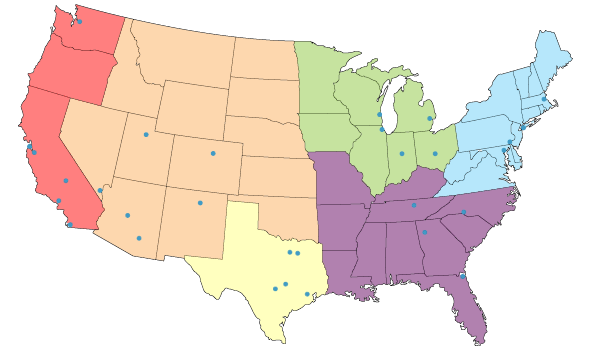
Midwest Map
Mountain Map
West Coast Map
Texas Map
Southeast Map
East Coast Map
Circle of Blue provides relevant, reliable, and actionable on-the-ground information about the world’s resource crises.






Leave a Reply
Want to join the discussion?Feel free to contribute!