When It Comes To Water Service How Expensive Is Too Expensive?
As rates rise, water authorities question longstanding affordability measurement.

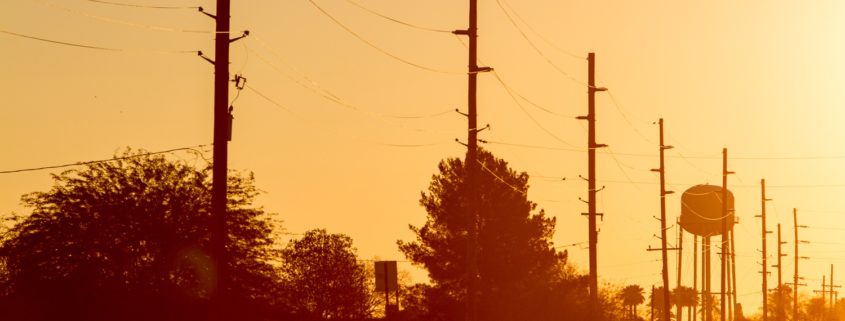
Sunset colors the sky a pastel orange above a water tower on the Gila River Nation, in central Arizona. Photo © J. Carl Ganter / Circle of Blue
By Brett Walton, Circle of Blue
Earlier this year, Manny Teodoro, a Texas A&M University associate professor, sat in a meeting with a committee that advises the Phoenix Water Department on rates to discuss the increasingly fraught relationship between household water bills and the ability of residents to pay for water service.
Teodoro, a scholar who evaluates the consequences of public policy, was developing a method to measure the financial burden of water bills on the poor. Phoenix officials wanted fresh insight they could perhaps incorporate in aid programs and rates.
At some point the conversation took a slight, but revealing, turn. Affordability is a comparative concept, the place where income and expenditures cross. Teodoro was talking about measuring that relationship. In the water utility industry few tasks are as perplexing or misunderstood as gauging which customers can afford to pay their water bills and how much they can pay.
The committee members, though, wanted a definition. Household incomes at the economic bottom have stagnated. How many people will not be able to pay?
“Are our rates affordable?” they asked, posing a question that has become a defining issue for U.S. water utilities in the second decade of the 21st century.
Teodoro, reflecting on his work, instead redirected the query. “It’s up to you, not me,” he replied. “I’m showing you how to measure it.”
According to the U.S. Census Bureau, the number of households earning less than $US 15,000 per year grew more between 2000 and 2015 than any equivalent segment of the income distribution. At the same time water rates, driven by the cost to maintain or replace water treatment plants and delivery pipes, are rising at double or triple the rate of inflation. The trend, for booming cities and sleepy villages alike, shows no sign of slowing. The need to measure, define, and understand what is meant by affordable water, rates experts say, has never been more imperative.
Teodoro is a candid critic of established metrics and one of a number of researchers, utility officials, and government representatives who are pushing the industry toward a more nuanced analysis. That means tussling with questions — like the definition of affordability — that are in many ways philosophical, which is novel thinking for utilities that are accustomed to ticking boxes that were drawn by regulators.
“People are used to having a standard,” Teodoro told Circle of Blue. “The tendency is to look at the standard like a checklist without thinking through what affordability means. What is affordable is a normative question. In a democratic society it is up to our governing institutions to decide what that means. It might mean different things in different places.”
Utilities, being pushed into a larger social services role by City Hall and advocacy groups, are coming at the question from several angles. Phoenix is testing an analytical approach developed by Teodoro that incorporates disposable income and local wages. The Northeast Ohio Regional Sewer District, which serves the Cleveland metro area, and the water department for Raleigh, the capital of North Carolina, are using fine-grained U.S. Census data to define more clearly which households need financial aid.
Even Congress, where water affordability legislation is now a perennial topic, has taken action. Lawmakers ordered the National Academy of Public Administration, a research group chartered by Congress, to study alternative ways of measuring household water affordability. The report is due at the end of September.
A common theme among these endeavors is rejection of the prevailing wisdom, which is a two-decade-old standard used by the U.S. Environmental Protection Agency to assess the cost to water utilities of meeting federal pollution-control requirements. That is the standard that Teodoro and others want to upend.
The Old Way
When they fail to meet Clean Water Act obligations to cut the flow of untreated sewage and dirty street runoff into rivers, the EPA often requires cities to install system upgrades that can run into the billions of dollars for a large metro. Part of the regulatory process is a financial analysis, which assesses the community’s ability to pay for the improvements. If the best technology is too much of a burden, the community can get a waiver to use a less costly fix.
The EPA’s method, put in place in 1997, is rudimentary, a club not a scalpel. The agency compares the median household income (MHI) for the utility’s service area to the area’s average sewer bill. If the average bill after sewer system upgrades is not above two percent of MHI, the community passes the residential affordability part of the financial test. A similar metric is applied for drinking water improvements, except that the bar for “high” financial impact is set at 2.5 percent of MHI.
That community-level standard has taken on a life of its own. It has been applied broadly — mistakenly, some say — as an indicator of water and sewer bill affordability for individuals and households.
Critics of the EPA standard — both in its intended and unintended uses — are easy to find. Teodoro argues that MHI is used only because it is “convenient and conventional,” and it results in “lazy and deceptive” analysis. Jason Mumm, a rates analyst with JMa Municipal Advisers, a consultancy based in Colorado, says that the standard is a “ham-fisted” way of estimating financial capacity that ignores demographic and economic distributions that vary from city to city.
The MHI metric has four flaws, Teodoro asserts. One, it looks at average demand across the community instead of essential household needs. Average demand includes water that nourishes grassy yards as well as water consumption by the rich, who tend to use more. Average demand, in effect, inflates the amount of water a household needs. Utility leaders who have looked closely at the issue agree. “We don’t want to define affordability as being able to afford a lawn,” Kathryn Sorensen, Phoenix Water Department director, told Circle of Blue.
A second flaw is that using median income obscures the financial pressure on poor residents. Like for average demand, median income is a balance point between a community’s richest and poorest. A high median income can veil a large group of poorer residents.
Ed Buchan, a water department analyst for the City of Raleigh, recognizes this problem with MHI. “While the Raleigh service area overall is in good standing, there are highly stressed areas within the city,” Buchan told Circle of Blue. “If you used median household income for the whole service area, no one would qualify as stressed.”
Third, the EPA measure ignores the local cost of living, which varies widely within and between states. If other goods are cheap, then a higher water bill may not be as debilitating.
Lastly, the numbers used for the financial assessment — two percent of MHI for sewer bills and 2.5 percent for drinking water — appear to be somewhat arbitrary. A white paper prepared for the National Association of Clean Water Agencies by the engineering firm CH2M Hill notes that MHI as a measure of financial capacity originated in the Farm Home Loan program in the 1970s. Teodoro has found little documentation on why two percent was selected as the break point.
“It appears to be a pure ‘golden number,’ one with no empirical or theoretical rationale at all,” he said. “It’s become a number that people point to in an appeal to authority.”
There are more detailed records for the roots of the drinking water standard. The EPA considered a range of values, between 1.5 percent of MHI and three percent. The agency settled on 2.5 percent after looking at national-level averages for household spending on transportation, energy, telephone service, entertainment, and other categories, as well as at the cost of using faucet filters or bottled water for in-home drinking water. The agency reckoned that 2.5 percent was less than spending on home heating and air conditioning and more than the cost of filters or bottled water.
The EPA press office said their financial specialists were not available for an interview to discuss the origins and application of the MHI standard.
An Affordability Metric That Focuses on the Poor
Teodoro is poised to address the deficiencies with fresh analysis. He submitted a paper that outlines his methods and applies them to the 25 largest U.S. cities to an academic journal. The paper is in a second round of the peer-review process.
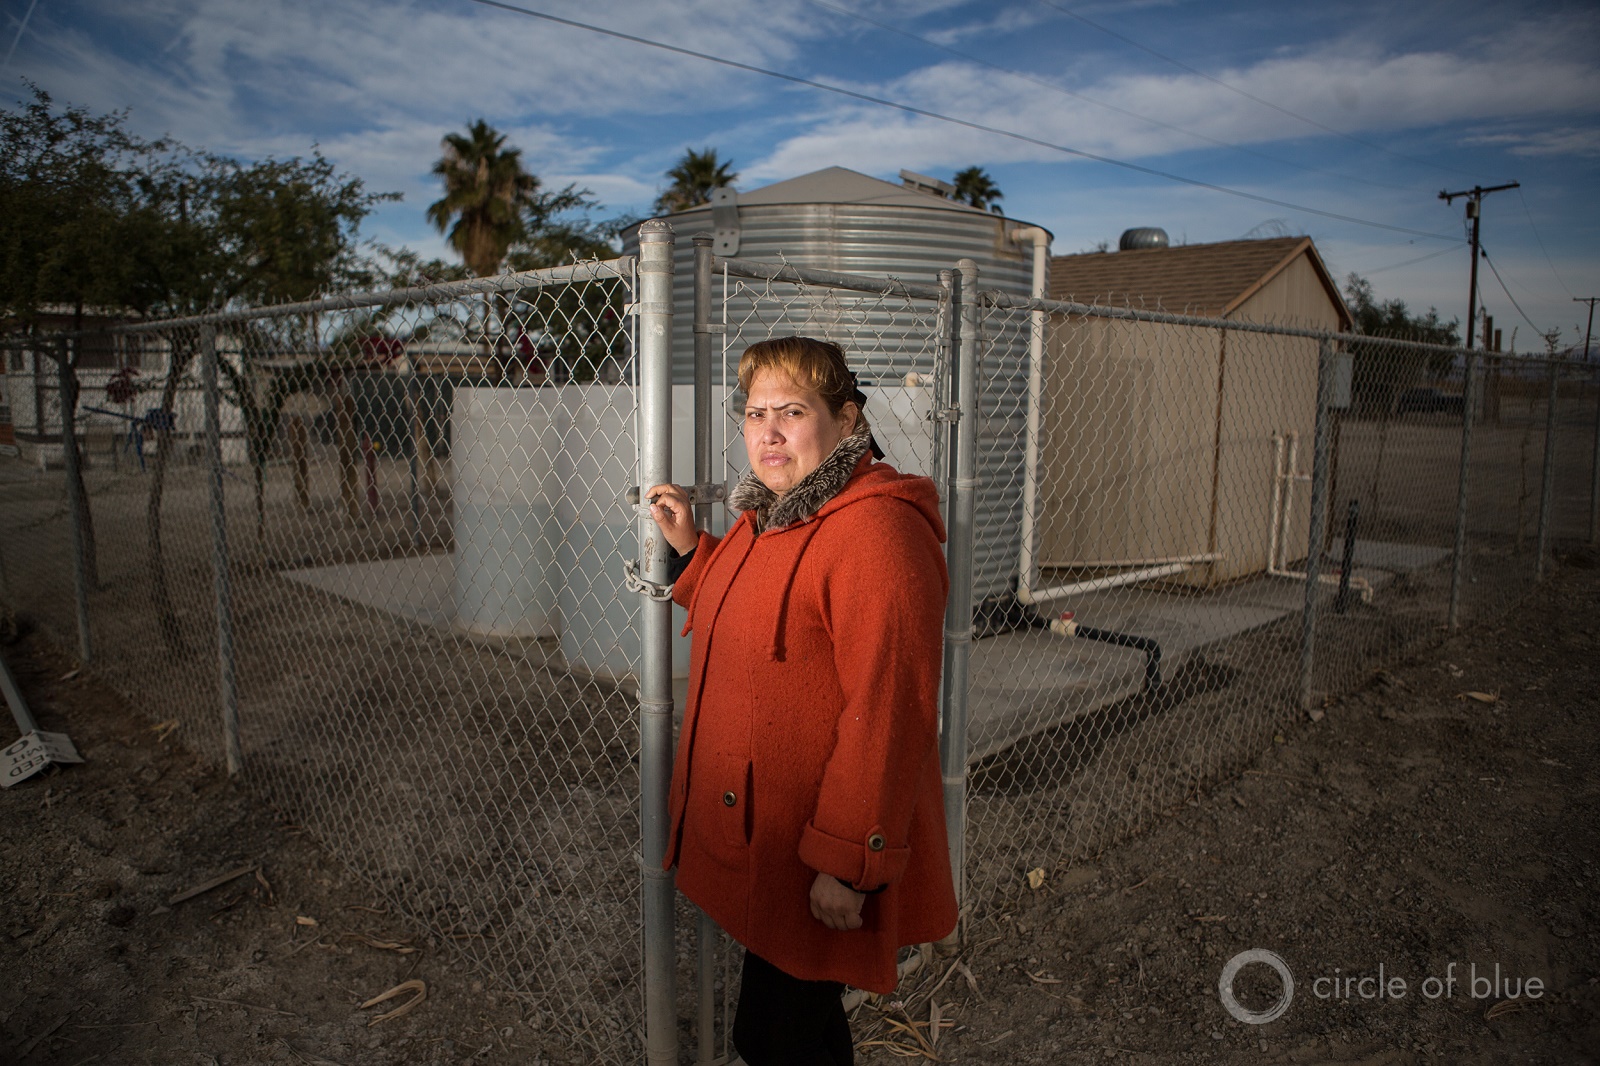
Migrant communities in southern California have to rely on unsafe groundwater supplies or drive to access clean supplies. A water filtration station at a mobile home park in the Coachella Valley removes arsenic from groundwater. It was paid for largely with state grants. Photo © J. Carl Ganter / Circle of Blue
Teodoro employs two approaches. One equates water bills with labor, tallying the number of hours at the local minimum wage that a person would need to work in order to pay for a monthly water bill at 50 gallons per day, which is an estimate of water needed for basic hygiene, drinking, and cooking. Cities can adapt this measure, but Teodoro proposes eight hours of minimum-wage labor as a starting point for discussion.
The second, called the affordability ratio, compares a water bill to disposable income for households at the twentieth percentile of the income distribution, meaning the bottom fifth, which is where affordability problems begin to be most apparent.
To calculate disposable income he subtracts essential expenses such as food, housing, energy, taxes, and health care. Then he calculates a monthly water bill for a household using 50 gallons per person per day. The water bill is then divided by disposable income to get the affordability ratio. Teodoro suggests that water bills are affordable for households at the twentieth percentile if they consume no more than 10 percent of disposable income. The method is, in fact, a template. Cities can fiddle with the input variables to match their assumptions about what affordability means.
There are drawbacks, though. The measurements do not work for renters, who often do not directly pay their water bill. Also, the calculations can be complex because cities need data on household income and expenditures. “It’s really difficult to pin down necessary versus discretionary spending,” said Mumm, who provided comments to Teodoro on the paper. Nonetheless, Mumm endorses alternative measurements and said that Teodoro is one of the sharper people thinking about the topic.
“Affordability is one of the most important issues for our industry and a defining issue for some time to come,” Mumm said.
Mumm, when he worked as an analyst for MHW Global, an engineering firm, had a hand in developing an affordability measurement of his own. Called WARi, the tool pairs utility billing data with financial data sorted by census block. Census blocks are the smallest unit of measurement in the federal survey, and they encompass several thousand people.
The Northeast Ohio Regional Sewer District used WARi to identify which neighborhoods to target for enrollment in the district’s bill assistance program, which offers a 40 percent discount to customers who are below 200 percent of the federal poverty level. The response rate from customers increased significantly, according to Ken Duplay, the chief financial officer.
Use What Is Available
Because it’s handy, utilities still refer to MHI in their affordability planning. But sometimes in more nuanced ways than comparing it to a bill averaged across the entire utility service area.
Last December, when it approved its first program to provide water bill aid to poor customers, the Raleigh City Council wanted to know how many people might need financial assistance. The city, after all, had only so many dollars it could expend.
The water department developed a needs assessment based, in part, on the EPA methodology. The department used median household income data — but for census blocks, not for the city as a whole.
The department calculated an average household water and sewer bill based on a city-wide average of five hundred cubic feet (3,740 gallons) per month. Staff then compared the average bill to the median household income for each census block. If the bill was more than 4.5 percent of income — a figure based on the maligned EPA standard — then it was deemed unaffordable and the households in that block could qualify for bill assistance.
By looking at census block data, the department was able to see the scope of the problem in detail. The analysis showed that some 20,000 households, or roughly 10 percent in the city service area, qualified for the subsidy.
“It was a sobering number,” Buchan said.
Congress Orders Fresh Ideas
Perhaps the most anticipated assessment is a pending report from the National Academy of Public Administration, a body chartered by Congress to explore fundamental public policy matters. The report is designed to assist the EPA in revising its community affordability guidelines, if the agency chooses to do so.
Mandated as part of the 2016 federal budget resolution, the report is due to Congress in late September and will be released to the public soon thereafter, according to Brenna Isman, the project director.
A five-member panel, each of whom is an academy fellow, will write the report with the help of NAPA’s professional staff. Panel members are either academics or local government officials. The chair, Stan Czerwinski, is the chief operating officer of the National Governors Association.
The panel has convened four times, Isman told Circle of Blue, but its report will be based on the grunt work of NAPA’s professional staff, work that includes hundreds of interviews with water sector leaders, several roundtable discussions, and industry surveys. The surveys asked whether the two percent MHI figure is appropriate, whether it should be replaced, and what its successor should be. Roundtable participants included water industry trade groups and local government organizations: National Association of Clean Water Agencies, National Association of Counties, National League of Cities, U.S. Council of Mayors, Natural Resources Defense Council, American Water Works Association, National Rural Water Association, and others.
The U.S. Council of Mayors has been one of the most vocal groups lobbying the EPA to change how it evaluates affordability. Local and state governments, after all, account for more than 95 percent of capital spending on water infrastructure. “They’re dealing with it on the front line,” Mumm said. At their annual meeting in July 2016, the mayors adopted a resolution that encourages the EPA to be more comprehensive in its evaluation of a community’s ability to pay by including all federal mandates, and not just for water, in the assessment.
A Matter of Priorities
Mumm says that even though the EPA numbers are flawed, there still is value in providing guidance to water utilities as they take on unfamiliar tasks.
“Manny [Teodoro] doesn’t like the two percent figure, but from a policy perspective we need something that gives a sense that the cost of service is getting up there, a barometer if you will,” Mumm said. “I think the EPA needs to have something that is an effective tool: ‘Is this too much to ask for a community?’ The question is how to change how the EPA measures it, to get a better barometer.”
Sorensen, the Phoenix Water Department director, says that though affordability will require local solutions, collective leadership is also necessary: “It is incumbent on the water industry as a whole to come up with guidelines that are reasonable.”
Teodoro, for his part, recognizes that getting an industry to change its ways will be a challenge. If better measurements are a means to that end, then he has a path laid out. After profiling 25 cities for the journal article, Teodoro wants to expand the analysis to cover several hundred U.S. utilities. He’ll provide the measurement, but utilities will have to decide where, in the relationship between prices and incomes, to mark the transition from affordable to unaffordable.
“I’m evangelizing right now,” Teodoro added. “Getting people to break habits is difficult. It will take time but more utilities are looking so they’re taking it seriously.”
Brett writes about agriculture, energy, infrastructure, and the politics and economics of water in the United States. He also writes the Federal Water Tap, Circle of Blue’s weekly digest of U.S. government water news. He is the winner of two Society of Environmental Journalists reporting awards, one of the top honors in American environmental journalism: first place for explanatory reporting for a series on septic system pollution in the United States(2016) and third place for beat reporting in a small market (2014). He received the Sierra Club’s Distinguished Service Award in 2018. Brett lives in Seattle, where he hikes the mountains and bakes pies. Contact Brett Walton

