
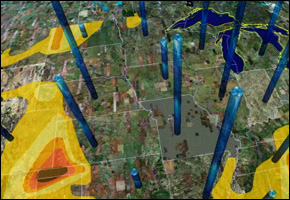
U.S. water usage by state on Google Earth
Using United States Geological Survey data from the most recent U.S. water consumption reports, Circle of Blue has generated a new visualization of water use by state. The Google Earth module also includes data for the U.S. Drought Monitor.
Click here to download the module.
Circle of Blue’s east coast correspondent based in New York. He specializes on water conflict and the water-food-energy nexus. He previously worked as a political risk analyst covering equatorial Africa’s energy sector, and sustainable development in sub-Saharan Africa. Contact: Cody.Pope@circleofblue.org


I am unable to download the module for “U.S. water usage by state on Google Earth”. What program do you need to run the program?
Nielsen,
You need to download “Google Earth”. The app can be found here.
Thanks,
C.T.
Comments on, “WATER MY RESOURCE MY RESPONSIBILITY” are invited from all on my E-mail Id
The data the USGS reports is generally in million gallons per day (MGD), not total annual use – is that what shows up in when the app is run? Clarification of that would be helpful. Also, if you ever thought of updating this app, the data is broken out into many useful categories – groundwater use, surface water use, water used by agriculture, municipal use, etc. It might be interesting to look at the data on that level in the future.
The description of the map above cites the use of USGS water consumption data (last published in 1995), however the map itself cites the use of USGS withdrawal data. These are two very diffferent data sets. Could you clarify which data set was used for generation of the map?
The description of the map above indicates that the USGS water consumption data set (last published in 1995) was used to create the map. The description on the map itself indicates that the USGS water withdrawal data set from 2000 was used to create the map. Could you clarify which data set was used?
i feel now world water is bad
Let’s hope that things would be better soon.