Posts

Film Review: ‘Divide in Concord’ Details Revolution of America’s First Bottled Water Ban
0 Comments
/
Photo courtesy of Kris Kaczor / 750 ProductionsJean Hill fought…

Map: Not All Phosphorus Is the Same
A breakdown of the different types of phosphorous in Ohio's Maumee and Sandusky rivers that have led to algal blooms in Lake Erie since the 1970s.
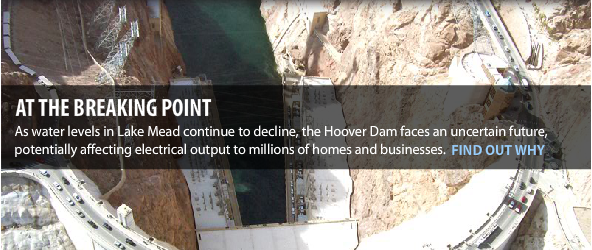
Infographic: Hoover Dam’s Troubled Waters
Completed in 1935, Hoover Dam supplies electricity to 29 million people in Arizona, California and Nevada.
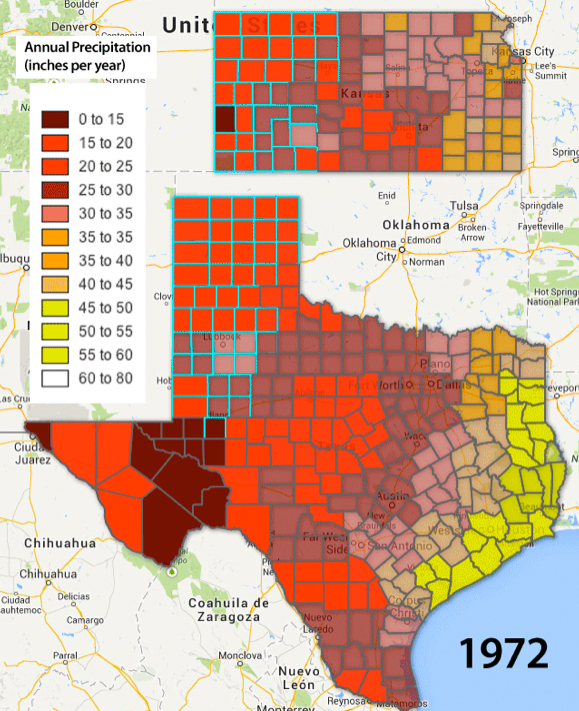
Infographic: Ogallala Precipitation in Motion — 72 Years Animated GIF (1940 – 2012)
When layered, maps of annual precipitation in Texas and Kansas show the stark moisture division in the United States between the wet East and the dry West running through the Great Plains.
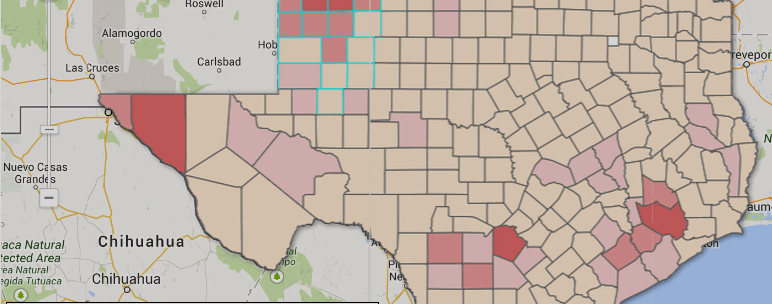
Map: Kansas and Texas Fresh Groundwater Use (1985-2005)
Click through the interactive Google Fusion Tables infographic to see how water use has changed over the last two decades, as well as how these trends relate to fluctuation of groundwater tables within the Ogallala Aquifer since the 1940s.
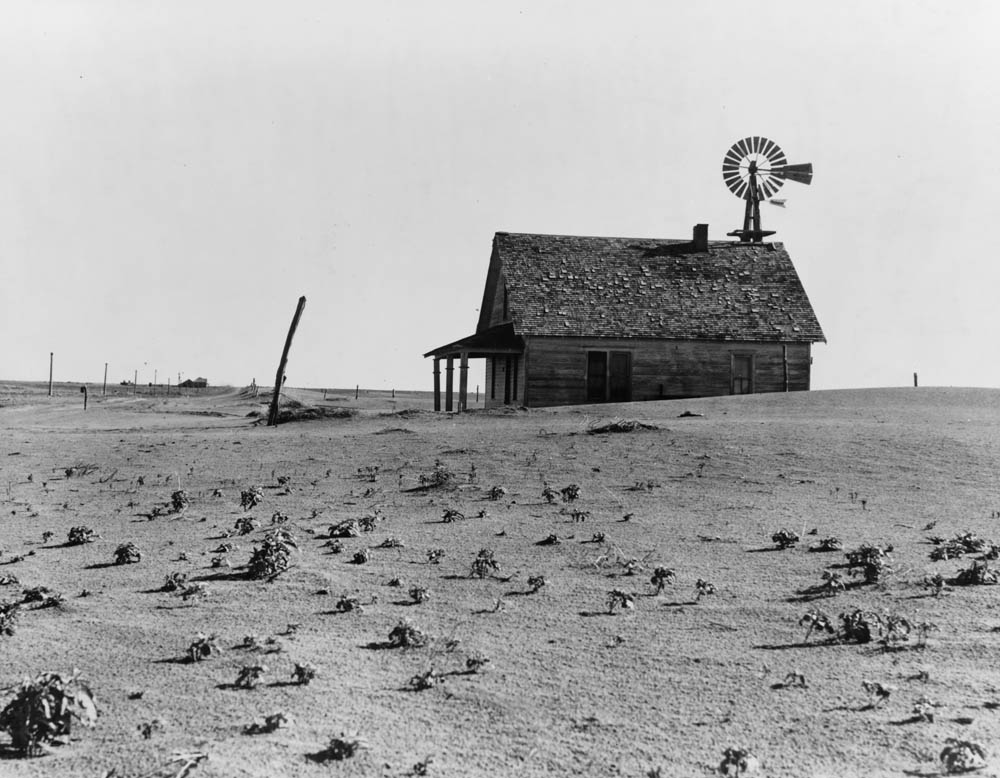
Slideshow: Drought in the Southern U.S. Plains Today Recalls the 1930s Dust Bowl
Strong winds and dry soils are a frightful combination.
The…

Map: California’s Water Use Per County (1985-2005)
Click through the interactive Google Fusion Tables infographic to see how California’s water use has changed over the last two decades and how these trends relate to population demographics and water contamination.

Q & A: Julene Bair, Author of The Ogallala Road
Fancy machinery and irrigation systems that pull millions of…

Great Lakes Ice Cover Most Extensive in 20 Years
Covering about 88 percent of the lakes on February 13, the ice…
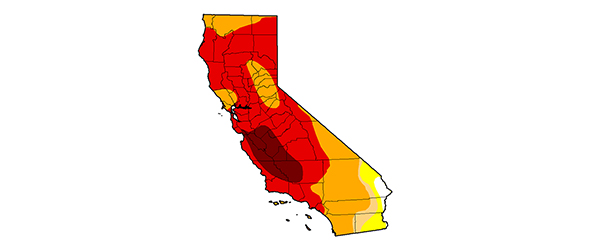
Infographic: California Drought In Motion — 10 Dry Years Animated GIF (2003-2014)
When layered, weekly images of the U.S. Drought Monitor for California show how much worse this drought is than any in the past decade.
Infographic: West Virginia Chemical Spill Spreads to Ohio River
Spill shut down drinking water for 300,000 people.
Infographic…

Photo Slideshow: California’s Lingering Drought and Pollution Defy Solutions
Less snowmelt from Sierra Nevada leads to more pumping of Central Valley’s contaminated groundwater.

