Posts
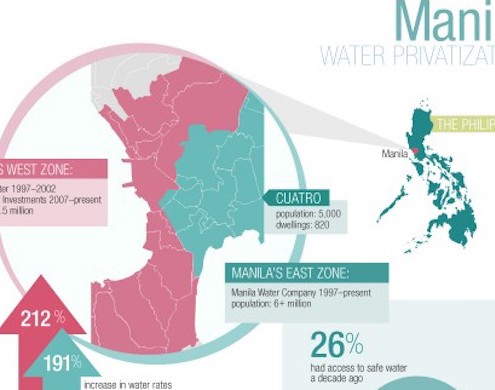
Infographic: Water Privatization in the Philippines
0 Comments
/
Breaking down the history of water privatization in the Philipine capital of Manila, this infographic explores the city's varied success with privatization using a timeline and a map.
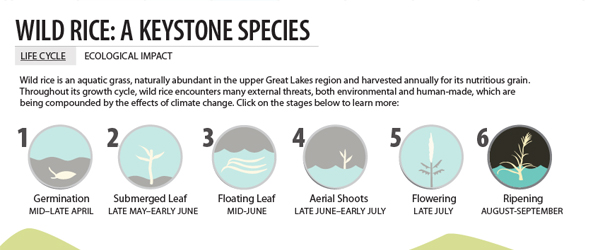
Infographic: Wild Rice is Keystone Species for Upper Great Lakes Region
Wild Rice is an aquatic grass that is harvested annually for…
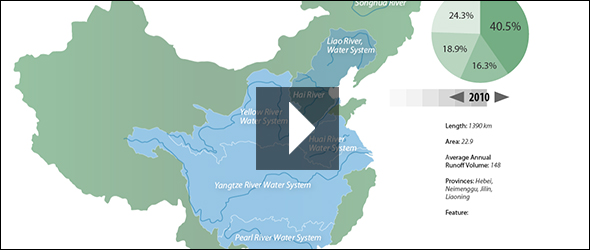
Infographic: Map of Pollution Levels in China’s Major River Basins
The seven major river basins, as a whole, have had steady improvements in water quality over the past decade.
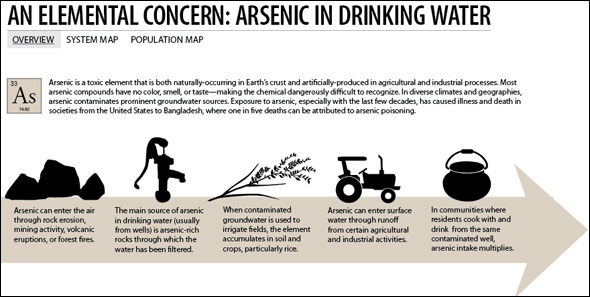
Infographic: An Elemental Concern—Arsenic in Drinking Water
Arsenic is both naturally occurring and artificially produced, and the toxin is very dangerous since it often has no color, taste, or smell. This graphic breaks down how arsenic gets into drinking water supplies and how arsenic affects the U.S. on the state level.
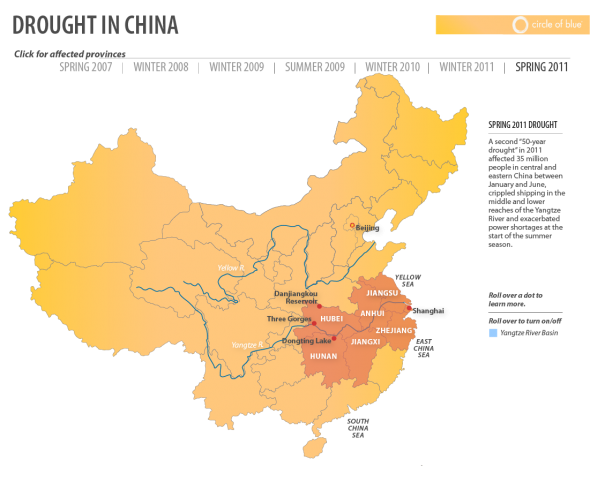
Infographic: Interactive Timeline Mapping China’s Drought-ridden Provinces Since 2007
Water scarcity is becoming an increasingly persistent problem…
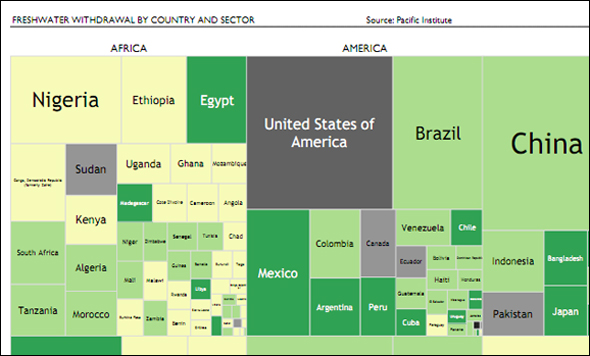
Infographic: Tree Map of Freshwater Withdrawal by Country — A Comparison Between Continents
Does the population of a country affects to its freshwater withdrawal? and its geographic location? Are there differences between Continents? and within them? How the availability of freshwater is spread around the economic sectors?
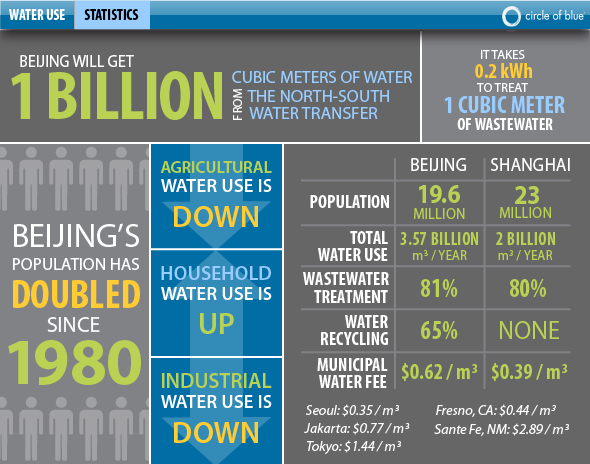
Infographic: Beijing Water Use and Population Statistics
The population of China's capital has doubled since 1980, and, though agricultural and industrial water use is down, municipal use is up.
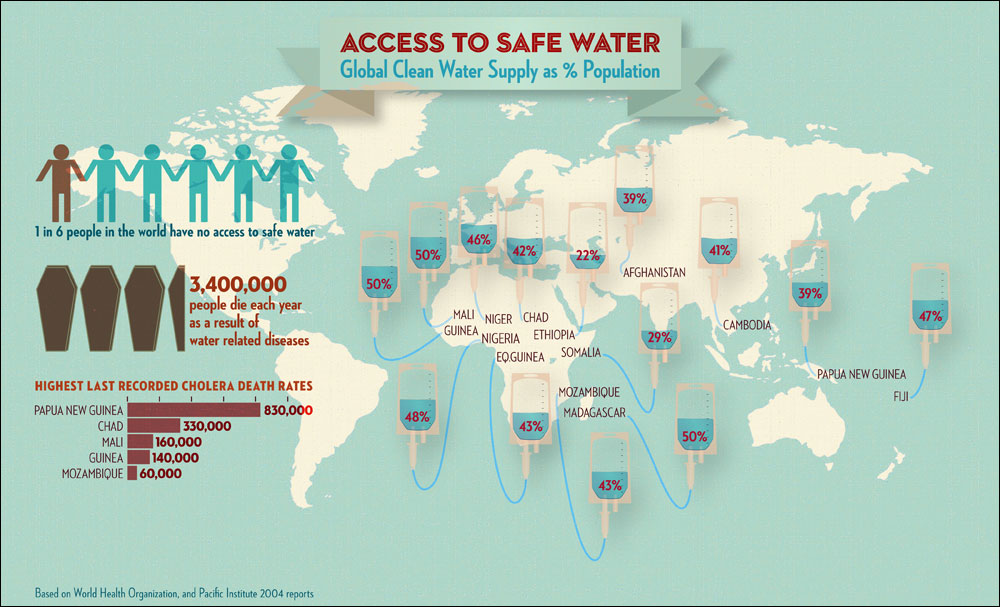
Infographic: Access to Safe Water—Countries Where Less Than 50 Percent Have Access
Global clean water supply by countries those less than 50% of the population can reach, and its facts, based on WHO and Pacific Institute 2004 reports.
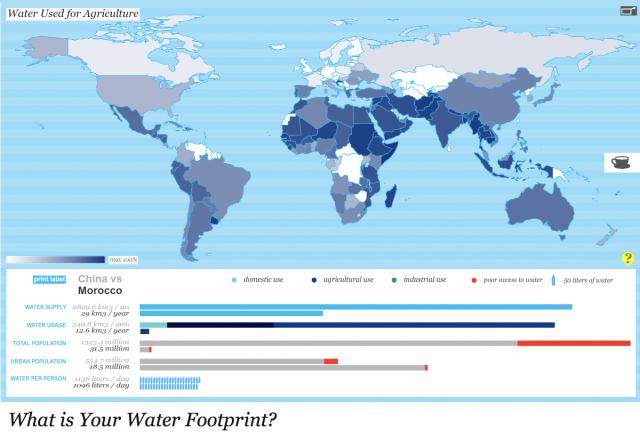
Harvard Students Win Urban Water Design Challenge for Interactive Water Footprint Infographic
Three weeks, 36 entries: Global competition sponsored by Circle of Blue and Visualizing.org.
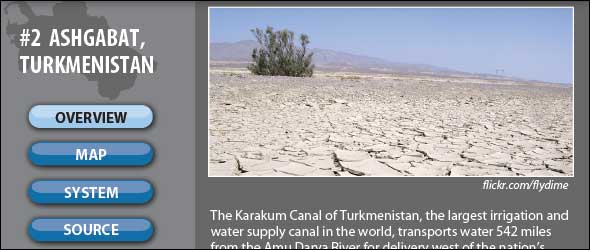
Infographic: Going the Distance, From Ashgabat to Whyalla—10 Cities Pumping Water From Afar
In many cities, water travels far to reach the tap. Residents of the planet's driest places rely on extensive waterways to deliver their supply. Click through the interactive infographic below to learn more about 10 cities that pipe water in from distant aquifers, plus additional plans to expand waterway networks even further.
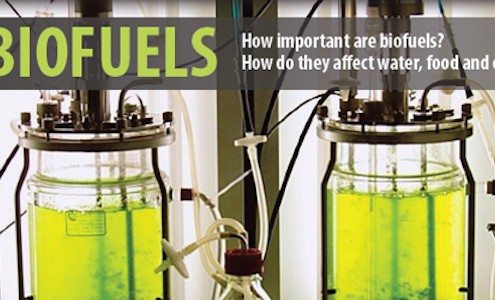
Infographic: Biofuels 101 — Water Use from Plant to Power Source
Production of ethanol, the most commonly used biofuel, has prompted concerns about water use and food supply.
 https://www.circleofblue.org/wp-content/uploads/2009/06/cerrargaleria.jpg
200
290
Nadya Ivanova
https://www.circleofblue.org/wp-content/uploads/2018/06/Circle-of-Blue-Water-Speaks-600x139.png
Nadya Ivanova2009-06-12 15:44:582009-06-12 16:01:59Art for Water, ‘Water for Life’

